
In 2023, equity markets experienced a significant shift with the outperformance of Growth and Cyclical segments, driven by factors such as resilient economic activity, decreasing inflation, and expanded valuation multiples due to the surge in sentiment around generative AI.
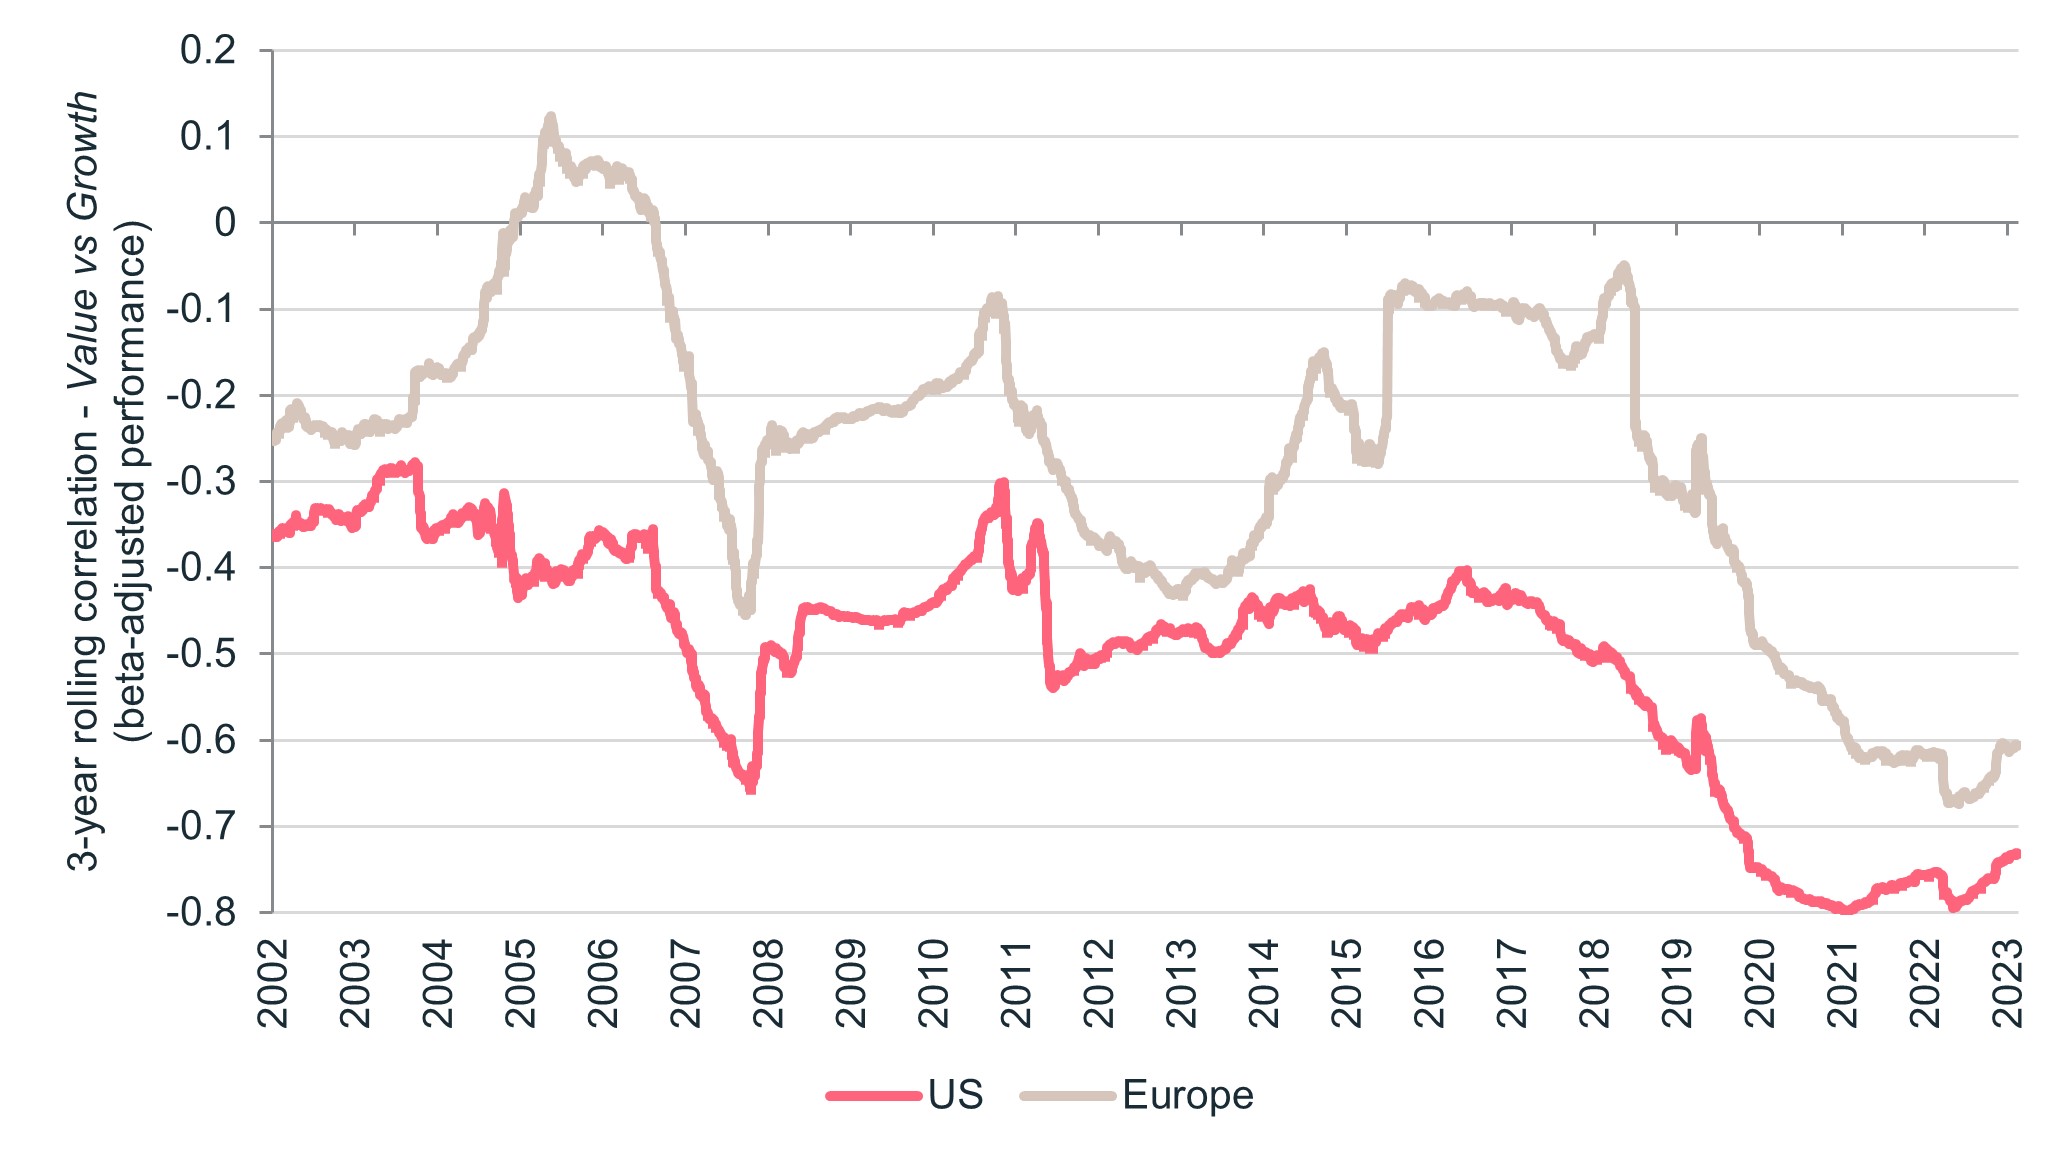
From another perspective, the market behavior in 2023 contrasted with the trends observed in 2022, a year that had been characterized by the outperformance of Value and specifically inflationary themes. More broadly, this Value/Growth opposition, and more specifically Inflation/Growth, has been the determining factor within equity markets since 2021, shaping the uncertainties of the post-COVID economic landscape. The extent of this polarization is also historic in relation to the correlation between Value and Growth which is now at its most negative level in 25 years, as shown in the chart below (Fig. 1).
Figure 1 – 3-year correlation value vs growth stocks (1999-2023) - Sources : Ostrum AM, FactSet
 To illustrate the dominant nature of this dynamic in the market, it is possible to determine the factors that better explain the variability of overall performance over a given period. This statistical method, known as Principal Component Analysis (PCA), is particularly useful:
- to rationalize the number of variables to be observed;
- to identify, in order of importance, the axes, called principal components, to be considered for interpreting the information.
Conducting this analysis on the performances of European and American equity markets over the past three years allows for displaying the correlations of different market segments to the first principal component. This is the axis that, taken individually, best explains equities’ behavior since 20211.
Figure 2 – Correlation between sectors and factors with the first principal component
(2021-2023) - Sources : Ostrum AM, Bloomberg, FactSet
Europe
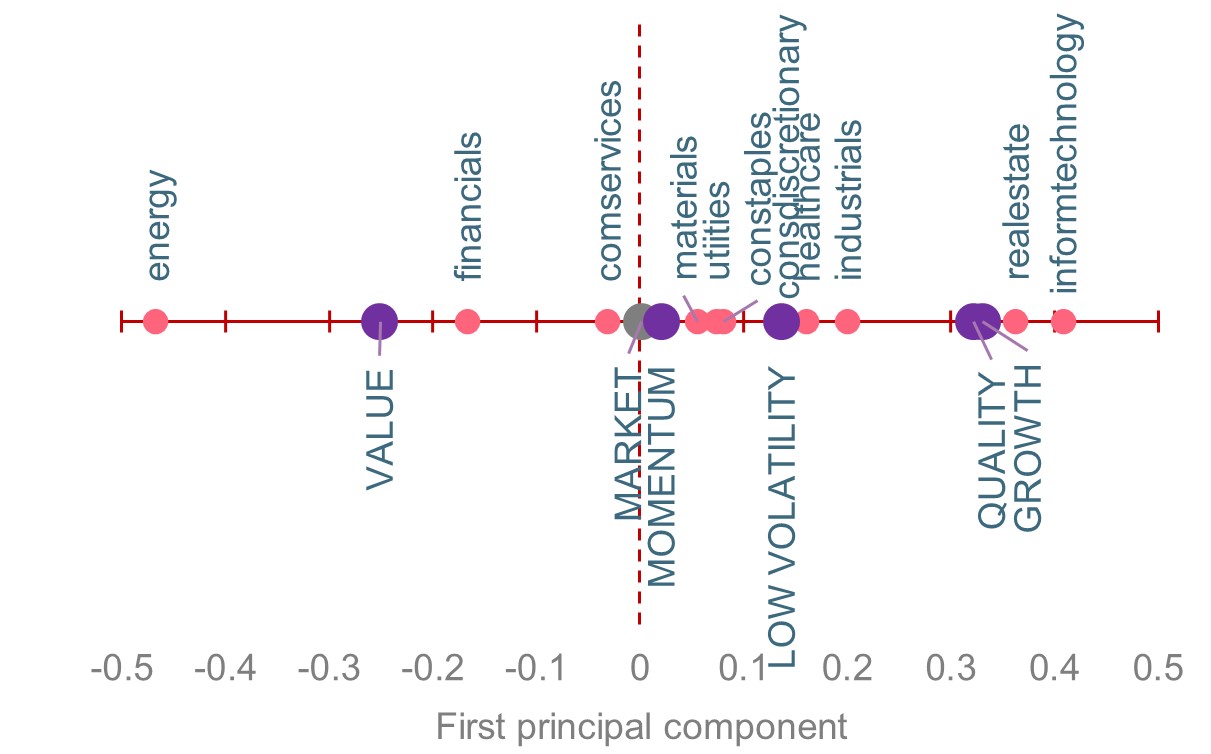
USA
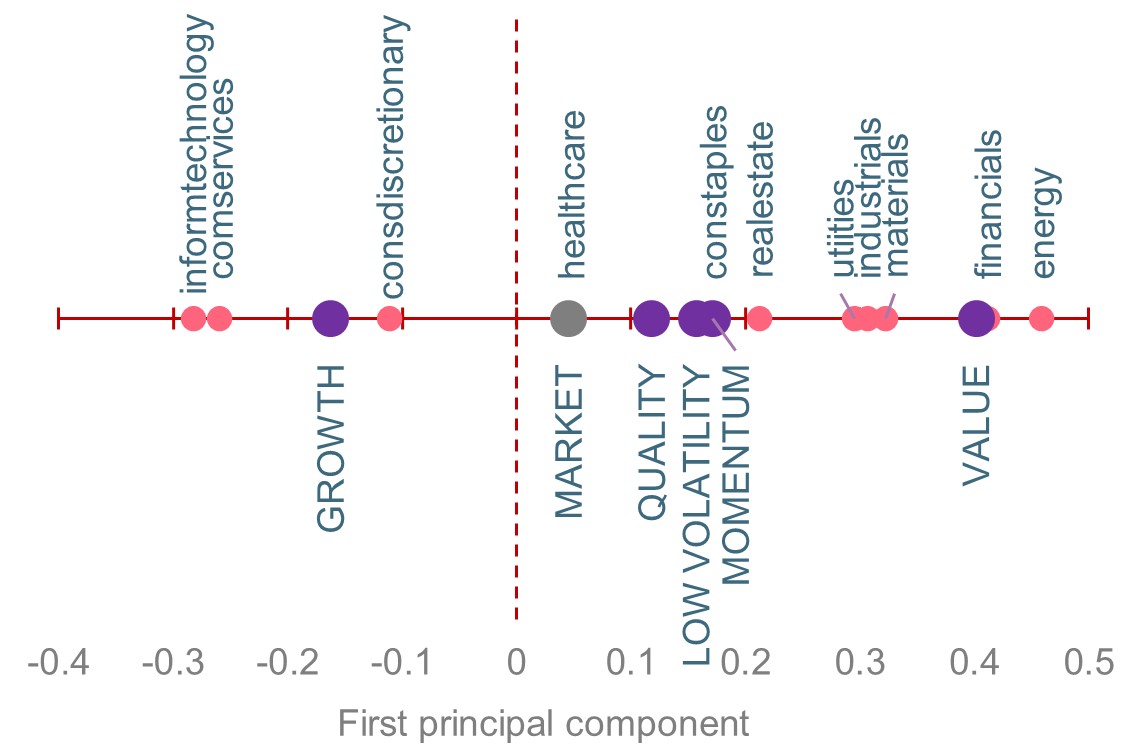
In the "Figure 2" chart above, this analysis revealed a clear opposition between Technology and Energy at the sector level, as well as between Value and Growth at the factor level. However, it is essential to recognize that this one-dimensional view could oversimplify the level of diversification offered by the Value vs Growth positioning. In practical terms, considering the market's evolution over the past three years, it may seem adequate to rely solely on a barbell portfolio built from two diametrically opposed concentrated exposures. However, expanding the previous analysis to a second axis reveals how flawed this conclusion may be.
In Figure 3 below, we have conducted the same exercise as before, but this time on the second principal component, i.e., the second axis, in order of importance, explaining the behavior of equity markets. This one, by construction, is decorrelated from the first component, thus allowing the isolation of a dynamic that is orthogonal to what we have seen so far. Expanding the analysis to a second axis through PCA uncovered a new interpretation of equity markets.
Figure 3 – Correlation of sectors and factors with the second principal component (2021-2023) - Sources : Ostrum AM, Bloomberg, FactSet
Europe
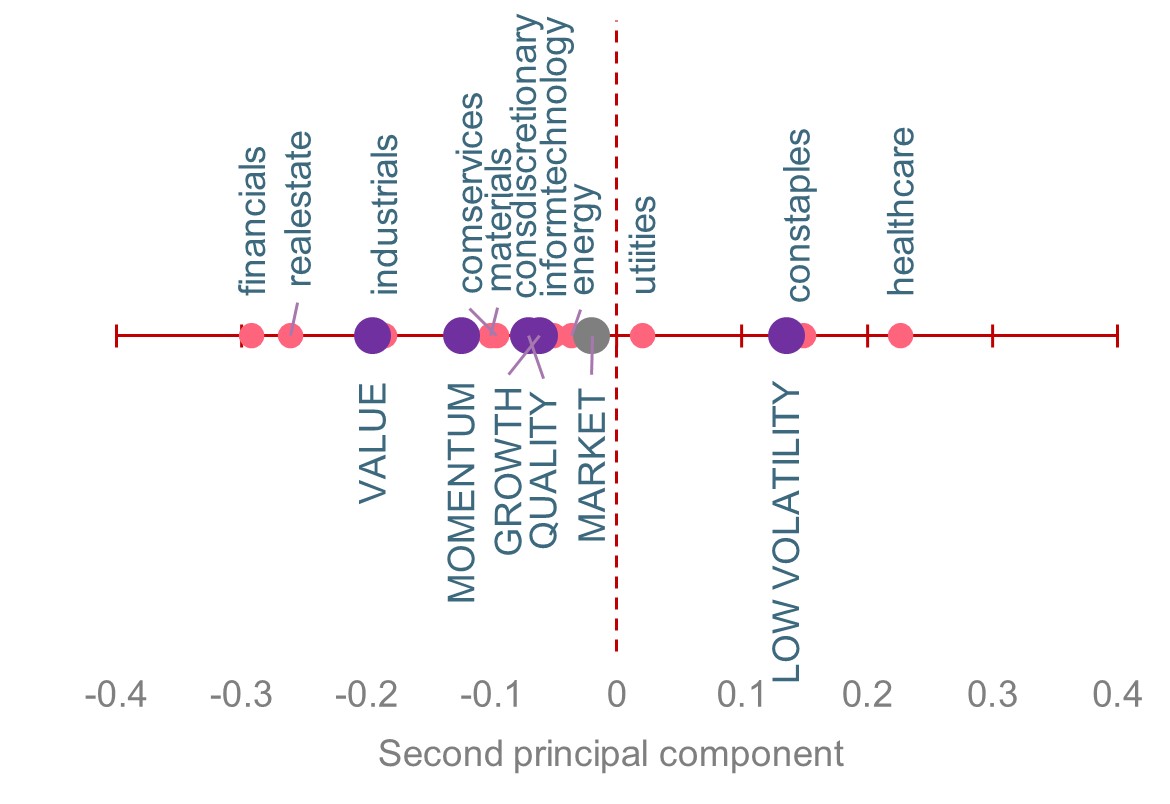
USA
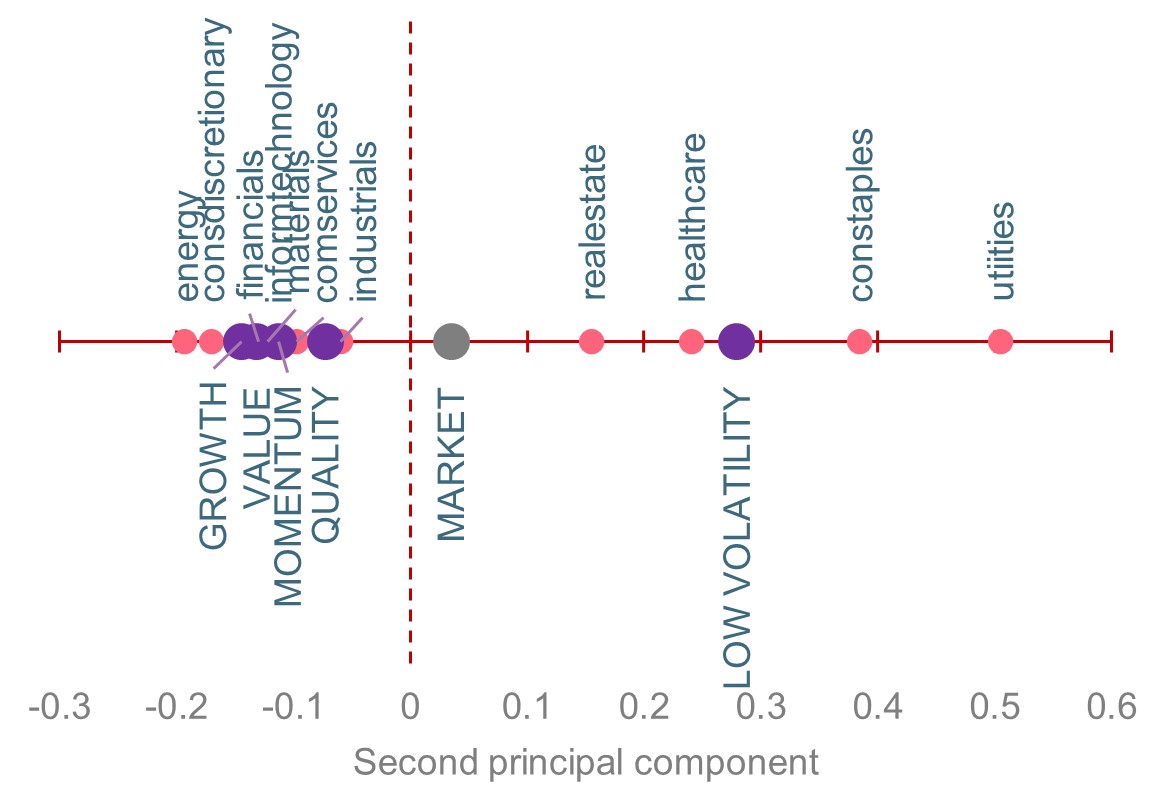
First, the Value/Growth antagonism disappears. Secondly, this analysis reveals that the most defensive segments, particularly the Low Volatility factor, offer a diversifying role that is currently overlooked by investors, to the point of reducing diversification to its simplest expression, namely a simple binary relationship.
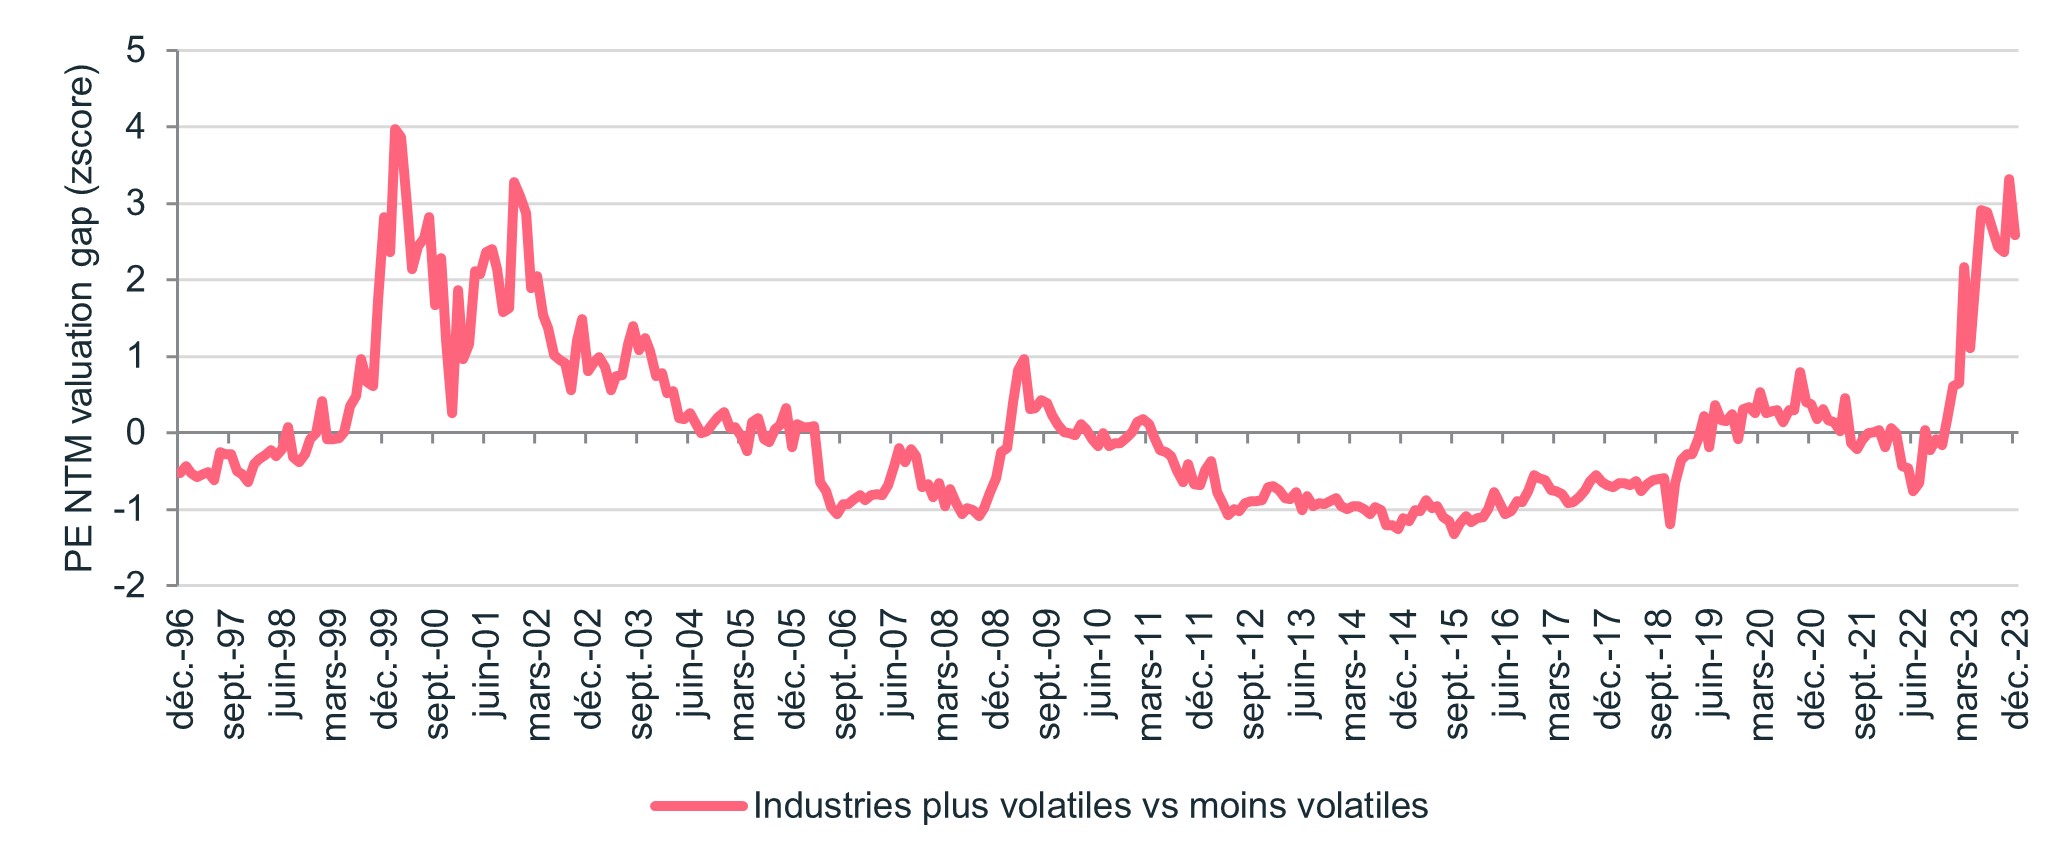
Moreover, as we have addressed in a previous publication, the historically high valuation of the more volatile industries compared to their less volatile counterparts (Fig.4 below) serves as evidence of the risk of concentration and excessive confidence in the current environment.
Figure 4 – Valuation spreads (12-month forward PE). Most volatile industries vs least volatile industries. MSCI AC World, December 2023 - Sources : Ostrum AM, Bloomberg, FactSet
We often remind that the absence of volatility is not equivalent to the absence of risk. On the contrary, the relationship between the two is often reflexive. Initially, the decrease in volatility positively alters participants' perceptions, consequently impacting prices positively and further shaping risk perceptions. At this stage, the relationship is self-reinforcing.
Yet, in the long run, this initial phase leads to increasingly higher risk-taking. Confidence turns into excess, capital allocation is no longer optimal, and risks are underestimated. The relationship becomes self-correcting, and extreme confidence in a concentrated market ultimately worsens the impact of future adjustments.
For an investor, pondering on which stage of this cycle we are currently going through can be crucial.
In the current context, discussions about the benefits of diversification are not necessarily well received. After all, one does not change a winning team! Portfolios concentrated around Tech companies, especially US Tech, have largely outperformed since the 2008 financial crisis and have further solidified their dominance with the recent emergence of generative AI. Still, it is also quite revealing that this recent outperformance is accompanied by record levels of relative valuation and an increasingly evident polarization in equity market dynamics.
As a result, a second crucial question arises: what is the objective of an investment choice? Investors should consider whether they seek to maximize gains in a single scenario or increase the number of scenarios in which they can hope to be successful.
In the latter case, we believe reevaluating diversification beyond superficial polarizations is essential. It means seeking out truly differentiating market segments, such as defensive sectors and securities can enhance the diversification strategy for investors, especially considering the fact that their valuation has not been this attractive in over 20 years.
1 In order to isolate the specific aspect of correlations, the analysis is based on beta-adjusted performances.
Diversification, the Blind Spot of Equity Markets
Download the insight