
Read our market review and find out all about our theme of the week in MyStratWeekly and its podcast with our experts Axel Botte, Aline Goupil-Raguénès and Zouhoure Bousbih.
Listen to podcast (in French only)
(Listen to) Axel Botte’s and Zouhoure Bousbih’s podcast:
- Review of the week – Iran's involvement and oil prices;
- Theme – Middle East conflict: Toward a 2022‑type scenario?
Podcast slides (in French only)
Download the Podcast slides (in French only)Topic of the week: Middle East Conflict: Toward a 2022‑Type Scenario?
- The escalation of the Middle East conflict has revived concerns over an energy shock reminiscent of 2022, triggered by the war in Ukraine.
- While the underlying drivers are similar, the nature of the shock differs. The current episode is primarily contingent on a tail‑risk scenario—namely a prolonged disruption of the Strait of Hormuz—rather than an already realized and structural supply breakdown as seen in 2022.
- The sharp surge in natural gas prices is weighing disproportionately on Europe, as in 2022, reflecting its continued reliance on LNG and limited storage buffers, with heightened exposure in countries such as Italy, Belgium, and Poland.
- The re‑emergence of a “2022‑type” market regime has translated into elevated volatility across sovereign bond markets, undermining traditional portfolio diversification and reinforcing the US dollar’s role as the dominant safe‑haven asset.
- A key distinction relative to 2022 lies in the financial environment. While the 2022 risk was driven by a macroeconomic imbalance between inflation and growth, the 2026 risk is fundamentally financial in nature, stemming from the buildup of leverage across the technology sector, artificial intelligence and private credit, and is likely to be exacerbated should the conflict persist.
Nature of the Shock: 2022 vs. 2026
2022: A Structural Shock
The war in Ukraine in 2022 triggered a structural energy shock for the global economy, and particularly for Europe, which imports the bulk of its energy needs. The lasting disruption of Russian gas supplies led to a persistent surge in energy prices. Governments, corporates and investors were forced to rapidly reassess and reprioritise investment decisions, largely irrespective of short‑term profitability considerations.
This forced reallocation of capital affected key infrastructure sectors, notably defence and energy. The shock proved durable, resulting in a sustained shift in inflation expectations and monetary policy outlooks.
2026: A Geopolitical, Potentially Transitory Shock
The military escalation in the Middle East primarily constitutes a geopolitical supply shock affecting global oil and natural gas markets. The charts below compare the market response of Brent crude and European natural gas to the 2022 energy shock.

The drivers of the shock are similar, but its nature is not.
The rebound in crude oil prices has been stronger than during the 2022 Ukraine shock, underscoring the region’s strategic importance in global oil supply. European gas prices have followed a trajectory similar to that of 2022, reflecting the impact of the blockage of the Strait of Hormuz, through which around 20% of global crude oil and natural gas supply transits.
The key difference is that unlike in 2022, this is not (at this stage) a structural supply shock, but rather the risk of an energy shock.
As in 2022, Europe is the most exposed
With gas prices rising, Europe is once again the most vulnerable region, as in 2022, to this renewed energy shock.
While the region has reduced its reliance on Qatari liquefied natural gas (LNG)—whose share in total gas imports declined from over 30% in 2017 to 8% in 2025—its supply has become more fragmented.
Italy continues to import 35% of its LNG needs from Qatar, making it the most exposed to a rapid increase in gas prices. Belgium and Poland are also vulnerable, with 17% and 25% of their LNG imports respectively still sourced from Qatar.

This energy vulnerability is further exacerbated by low gas storage levels. EU gas storage facilities were only 43% filled as of 28 January, a level lower than in 2024 and 2025 and well below the 2019–2025 average (by nearly 30 percentage points).
However, a major distinction relative to 2022 remains: in 2026, the energy shock is primarily contingent on an extreme scenario—namely a prolonged blockage of the Strait of Hormuz—that would keep Brent prices around $ 100, rather than on an already realized supply disruption, as was the case in 2022.
Financial Market Reaction: Striking Parallels with 2022
High‑beta asset classes came under pressure following the US‑Israeli strike on Iran. March 3 marked a turning point, triggering a shift in the underlying structure of financial markets.

Sovereign bonds no longer benefited from their safe‑haven status, which they had briefly regained a few days earlier amid concerns surrounding AI and private credit.
As in 2022, traditional portfolio diversification has come under strain. The chart above highlights that volatility in U.S. Treasuries (MOVE index) has risen more sharply than U.S. equity market volatility (VIX index), pointing to predominantly inflation‑driven risks for the U.S.
The US dollar has regained its safe‑haven role, at the expense of gold, which had fulfilled this function throughout 2025.
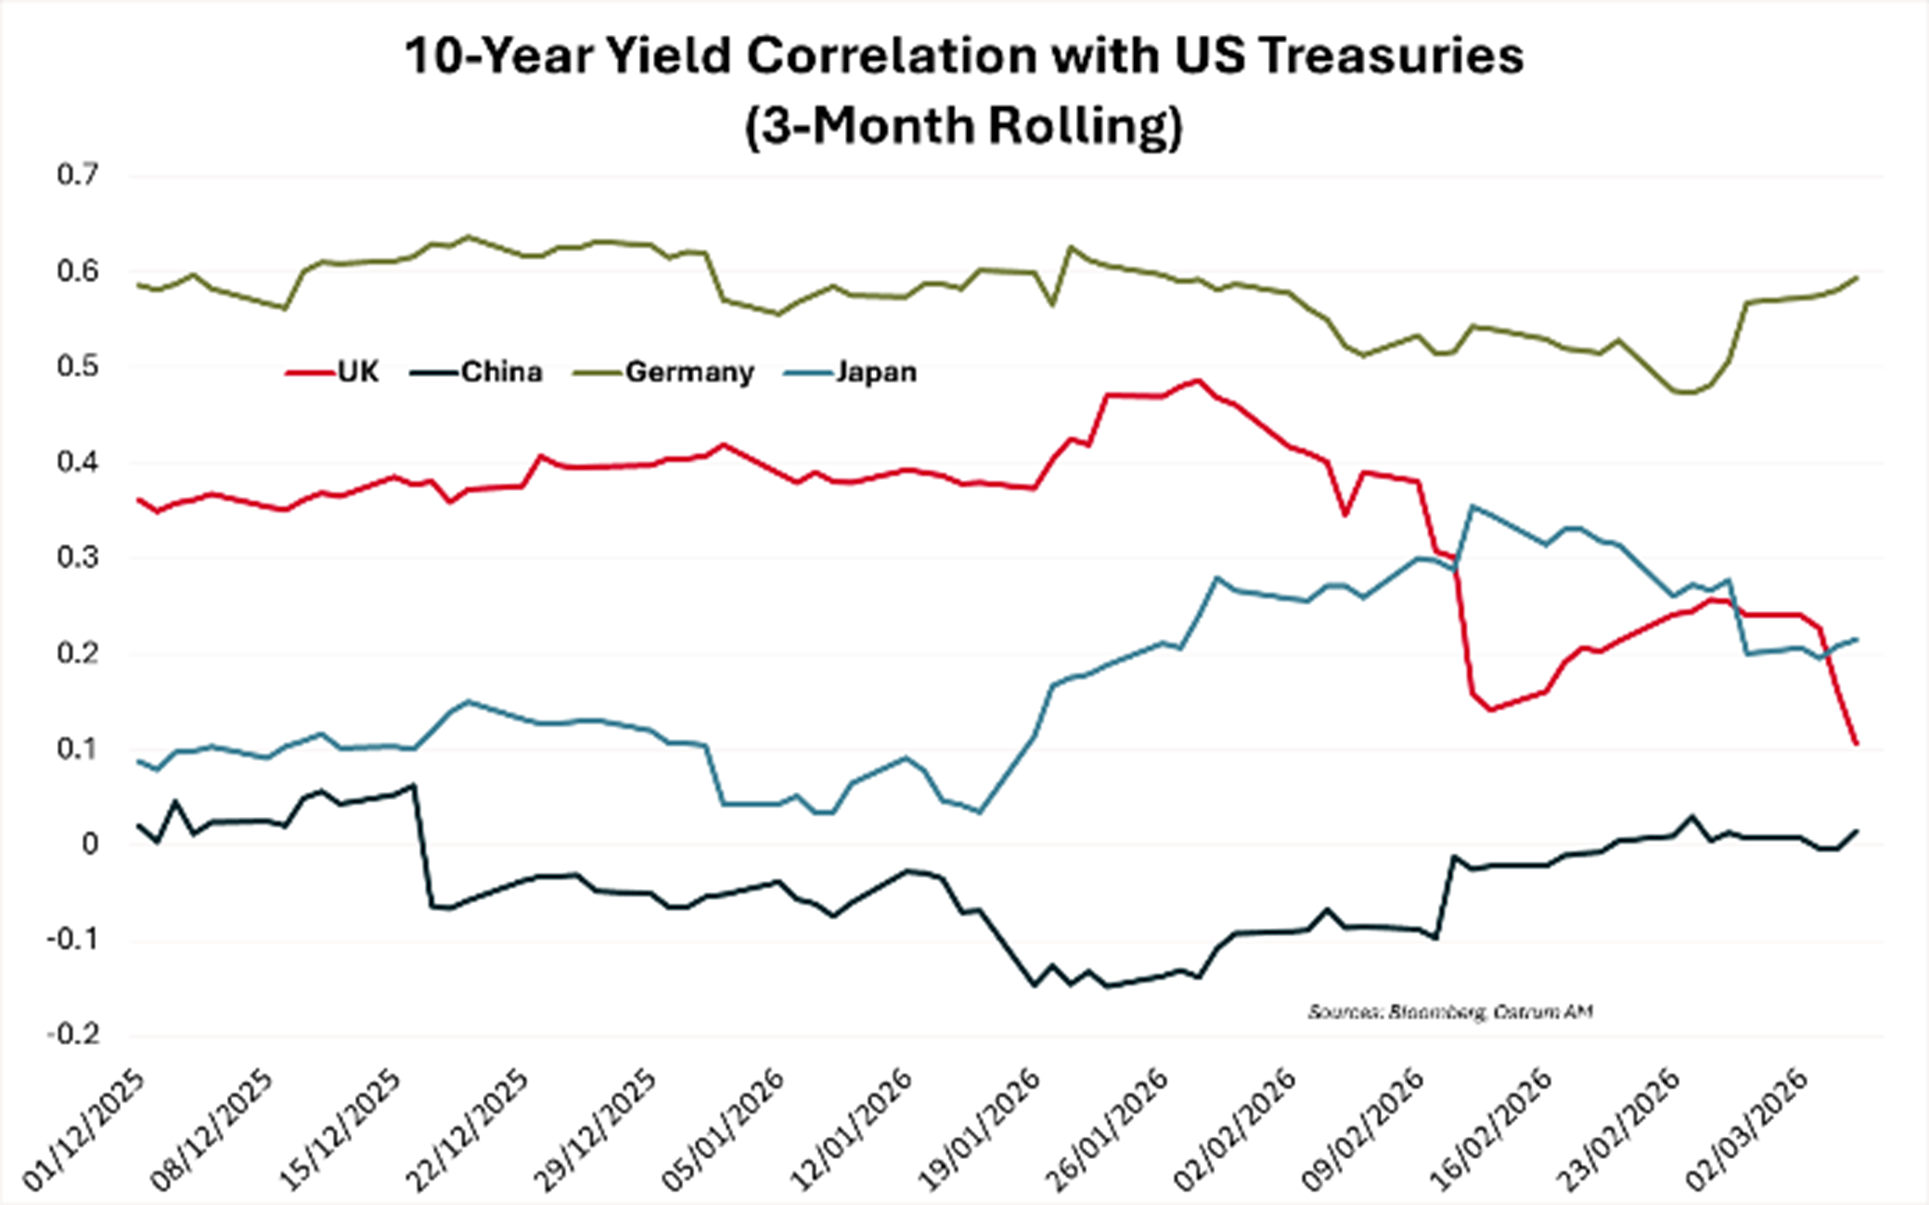
Another striking similarity lies in the behavior of Chinese interest rates, which remain largely insensitive, as illustrated in the adjacent chart.
The correlation between China’s 10‑year government bond yield and its US counterpart is close to zero, despite China’s exposure to the Middle East conflict through its imports of Iranian crude (accounting for 14% of total crude imports). China’s crude oil reserves amount to approximately 1.2 billion barrels, allowing the country to withstand supply disruptions for several months.
By contrast, the correlation of UK 10‑year yields has declined, reflecting the United Kingdom’s greater sensitivity to energy‑shock risks. Since 27 February, UK yields have risen by 46 basis points, twice the increase observed in US Treasuries over the same period.
… But a Key Difference Relative to 2022: the Financial Backdrop
In 2022, the epicentre of market stress stemmed from a classic macroeconomic imbalance: surging inflation driven by a sudden spike in energy prices, which in turn triggered an abrupt monetary tightening cycle.
In 2026, the risk is financial and endogenous. It arises from the accumulation of leverage across specific segments of the financial system, most notably those linked to artificial intelligence. AI has become a major conduit for capital allocation, heavily financed by debt—often outside traditional banking channels—in an environment where the cost of capital remains structurally higher than during the 2010s.
The risk is therefore no longer one of broad‑based inflation, but rather financial instability driven by leverage and the funding structure underpinning AI investment.
Conclusion
The Middle East conflict is reviving a market regime reminiscent of 2022, characterized by the return of the US dollar as the sole safe‑haven asset. However, unlike in 2022, the shock is not structural and instead acts as a catalyst for pre‑existing financial vulnerabilities, particularly in technology and private credit. The primary risk lies less in a lasting energy shock than in potential financial amplification should geopolitical tension.
Zouhoure Bousbih
Chart of the week
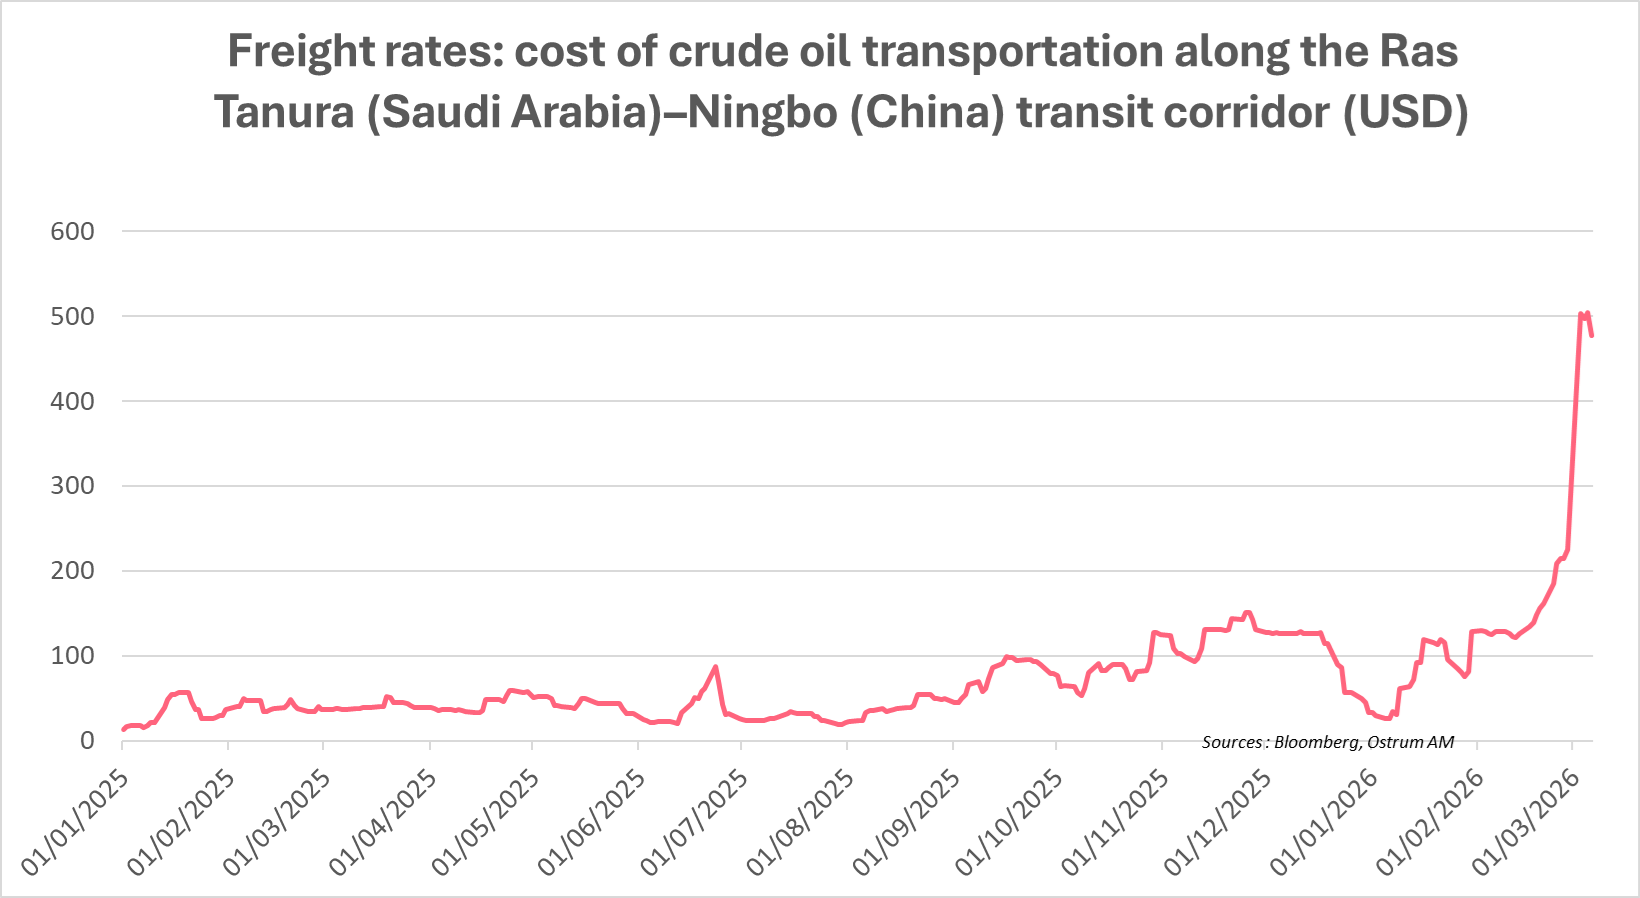
A sharp surge in maritime freight costs on the Ras Tanura (Saudi Arabia)–Ningbo (China) shipping corridor has followed the blockage of the Strait of Hormuz.
Freight rates have jumped by 1,200% since 27 February, signaling severe distortions in forthcoming crude oil deliveries. This metric is also a key indicator to monitor, as it may provide insight into the potential duration of the oil disruption.
Saudi Arabia is exploring alternative routing solutions to bypass the Strait of Hormuz, including diversions toward its Red Sea ports—routes that are themselves exposed to heightened risks from Houthi attacks.
Figure of the week
4.5
4.5% marks the lower bound of China’s new 2026 growth target, the weakest such target since 1991.
Market review:
- US Dollar: the dollar has regained its safe‑haven status.
- Rates: a broad‑based sell‑off driven by the repricing of inflation expectations and monetary policy outlooks.
- Equities: the end of the “Sell America” trade and renewed underperformance of Europe.
- Asia: Asian equities are bearing the full brunt of the sharp surge in crude oil prices.
A 2022 Replay in a Disrupted World
The inflation theme has resurfaced. A sell‑off in rates, the end of the “Sell America” trade, and the US dollar regaining its status as the exclusive safe‑haven asset have once again come to the fore.
The conflict in the Middle East has revived the spectre of the 2022 energy shock triggered by the war in Ukraine. As a result, market structures have shifted abruptly, displaying striking similarities with the 2022 episode. Brent crude prices surged to USD 115 per barrel, from a pre‑conflict average of USD 69, following the suspension of hydrocarbon production by several Gulf countries (Kuwait, Qatar and Saudi Arabia).
However, the most pronounced move was observed in European natural gas prices, which jumped by more than 67% over the week to EUR 52 per MWh, reflecting the closure of the Strait of Hormuz, through which around 20% of global liquefied natural gas supply transits.
The current energy shock has reignited inflation expectations on both sides of the Atlantic. With natural gas prices rising, Europe is once again the most exposed region, as in 2022. This has translated into a marked flattening of European sovereign yield curves, driven by a rise in short‑term rates. Inflation breakevens increased, particularly at the short end of the curve, confirming a repricing of inflation expectations and monetary policy outlooks.
That said, Germany’s 10‑year inflation breakeven, at 2.13%, remains well below the 3% level reached following Russia’s invasion of Ukraine, suggesting that markets do not yet anticipate a persistent inflationary impact from the conflict.
The BTP‑Bund spread widened by 13 basis points to 76 basis points, reflecting Italy’s greater dependence on Qatari LNG, which accounts for 35% of its total natural gas imports. The sell‑off in rates was more pronounced in UK Gilts, with yields rising by 40 basis points to 4.63% over the week, twice the move observed in US Treasuries.
A weak February US employment report, showing a decline of 92,000 jobs and a rise in the unemployment rate to 4.4%, briefly reversed the upward trend in US yields. However, the relief proved short‑lived, as stagflation concerns resurfaced. The VIX index closed above 29 for the first time in more than 200 days. European equity markets underperformed US indices, with the Euro Stoxx 50 down 7% over the week, while the Nasdaq (‑0.6%) and the S&P 500 (‑1.8%) largely erased their weekly losses.
The US dollar has reclaimed its crown as the exclusive safe‑haven asset, a role previously played by gold during the geopolitical tensions of 2025. One of the most striking similarities with the 2022 shock remains the insensitivity of Chinese interest rates, with the 10‑year government bond yield holding steady around 1.8%. China has set a lower growth target of 4.5–5%, the lowest since 1991. Several Chinese banks have begun reducing their exposure to the Middle East (USD 15.7bn).
Emerging markets have been hit hard by the risk‑off environment. Within days, the entire relative outperformance of emerging market equities versus US equities was wiped out, in the wake of the stronger dollar. Asian equity markets were particularly affected, given the region’s vulnerability to the sharp rise in energy prices. By the end of the week, Asian indices had stabilised but still posted negative weekly performances, with the Kospi down 10% and the Nikkei down 5.5%.
Zouhoure Bousbih
Main market indicators