Read our market review and find out all about our theme of the week in MyStratWeekly and its podcast with our experts Axel Botte, Aline Goupil-Raguénès and Zouhoure Bousbih.
Listen to podcast (in French only)
(Listen to) Axel Botte’s and Aline Goupil-Raguénès’ podcast:
- Review of the week – Trump searching for an exit;
- Theme – First signs of the energy shock's effects in the euro area.
Podcast slides (in French only)
Download the Podcast slides (in French only)Topic of the week: First signs of the energy shock's effects in the euro area
- The effects of the energy shock are beginning to be seen through the statistics in the euro area. Inflation accelerated to 2.5% in March due to the positive contribution of energy prices. This is only the beginning;
- According to the S&P Global survey, the sharp rise in input prices is not being passed on to selling prices, at least for now, with business leaders absorbing it into their margins. This is unlikely to last given the European Commission's survey, which signals a strong increase in 3-month selling price expectations;
- Household confidence deteriorated in March, with consumers anticipating a sharp decline in their living standard prospects due to a surge in 1-year inflation expectations. This comes at a time when the memory of the 2022 inflation is still significant, as evidenced by households' perception of still high inflation (3% in February);
- On March 25, Christine Lagarde stated that if the energy shock resulted in a significant but not too persistent overshoot of the inflation target, an adjustment in monetary policy could be justified, particularly as failing to react could pose a communication risk. Given all these factors, the sharp rise in energy prices should lead the ECB to raise its rates as early as June to demonstrate its unconditional determination to bring inflation back to 2% in the medium term.
Inflation accelerated to 2.5% in March
Inflation accelerated in March due to energy prices.
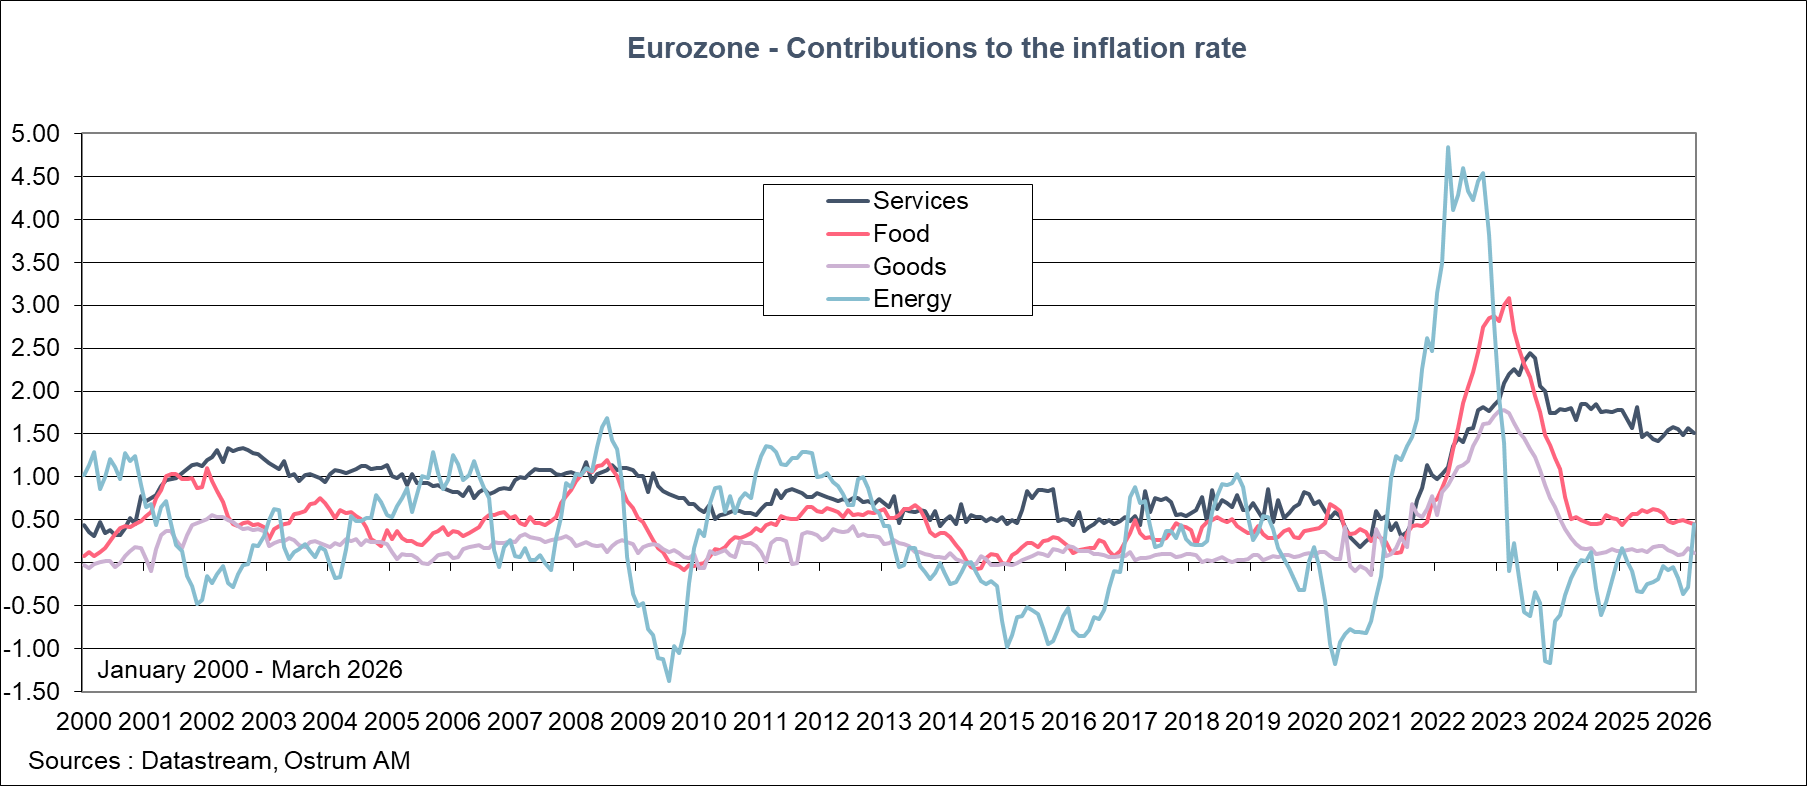
According to preliminary Eurostat figures, inflation in the euro area accelerated in March to reach 2.5% year-on-year, compared to 1.9% in February. Unsurprisingly, this is linked to energy prices. They increased by 4.9% year-on-year, whereas they had been falling over the past 12 months (down 3.1% in February). Food prices moderated slightly (2.4% after 2.5%), but caution is advised given the importance of the Strait of Hormuz in fertilizer trade. A prolonged closure would have delayed consequences on food prices. Core inflation (which excludes food and energy) moderated to 2.3%, from 2.4%, mainly due to the dissipation of the effect of the Winter Olympics on service prices in Italy. After accelerating to 3.4% in February, inflation in euro area services thus returned to the January level, at 3.2%.
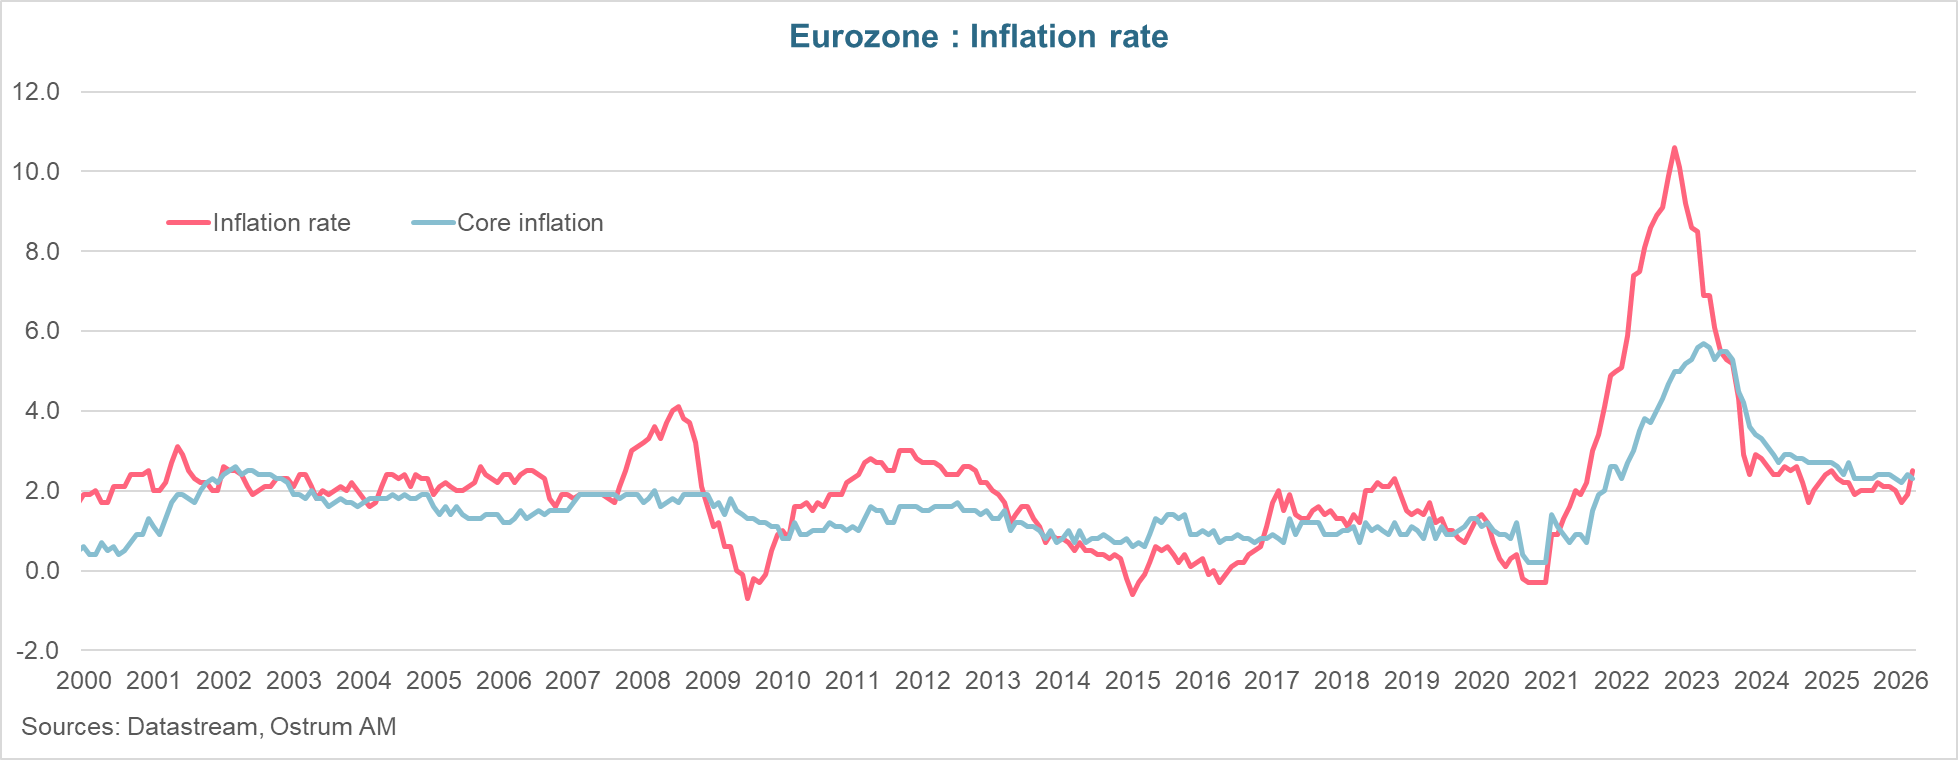
We are therefore beginning to see an impact of the near closure of the Strait of Hormuz on inflation through a renewed positive contribution from energy prices. We are far from the levels reached in March 2022 (7.4%), at the outbreak of the war in Ukraine. Inflation was already high in February 2022 (5.9%) due to the strong post-Covid demand catch-up and the resulting supply chain tensions.
Future diffusion of the rise in energy prices into other sectors of the economy.
This higher inflation in March is a first step. Prices are expected to continue rising as the increase in energy prices diffuses to other sectors of the economy (industrial and certain service sectors such as transportation).
Surveys of Business Leaders
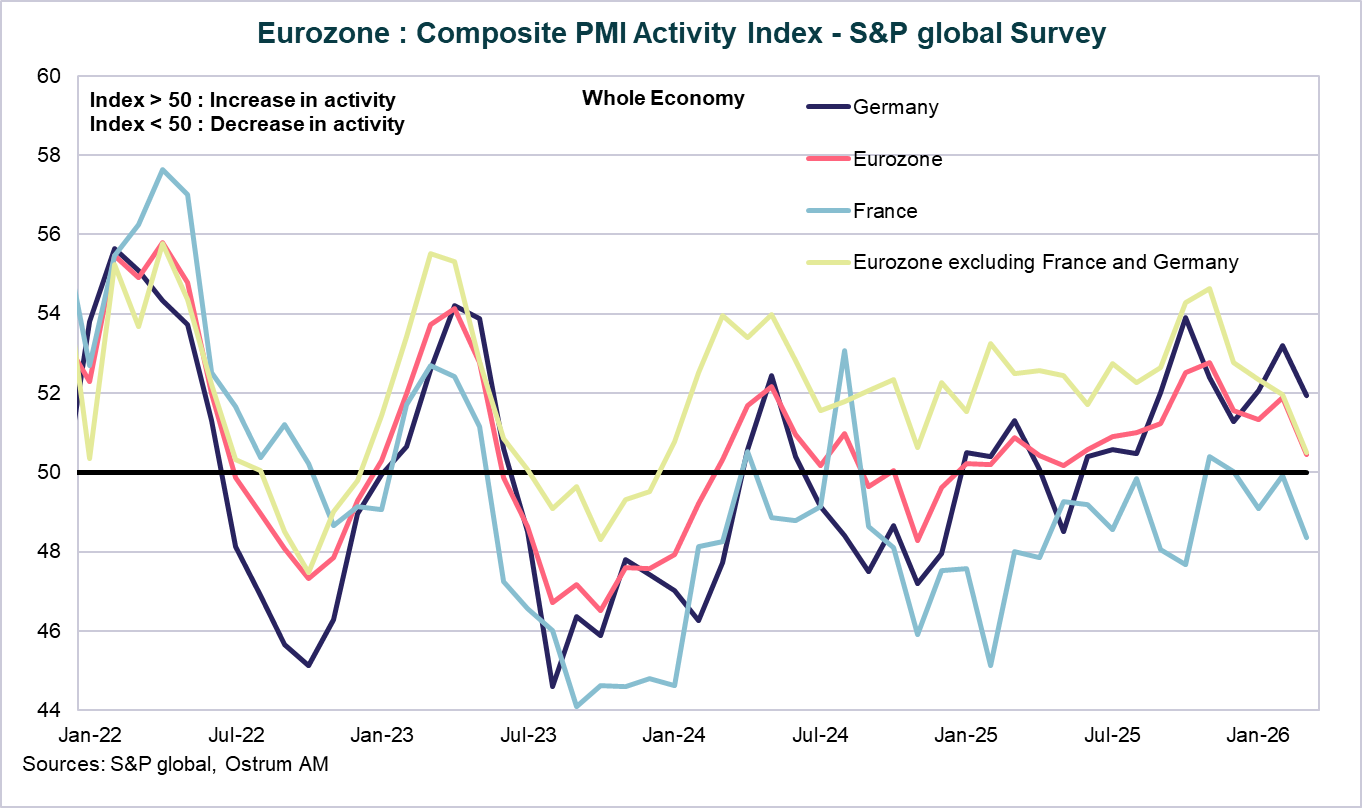
S&P Global Survey
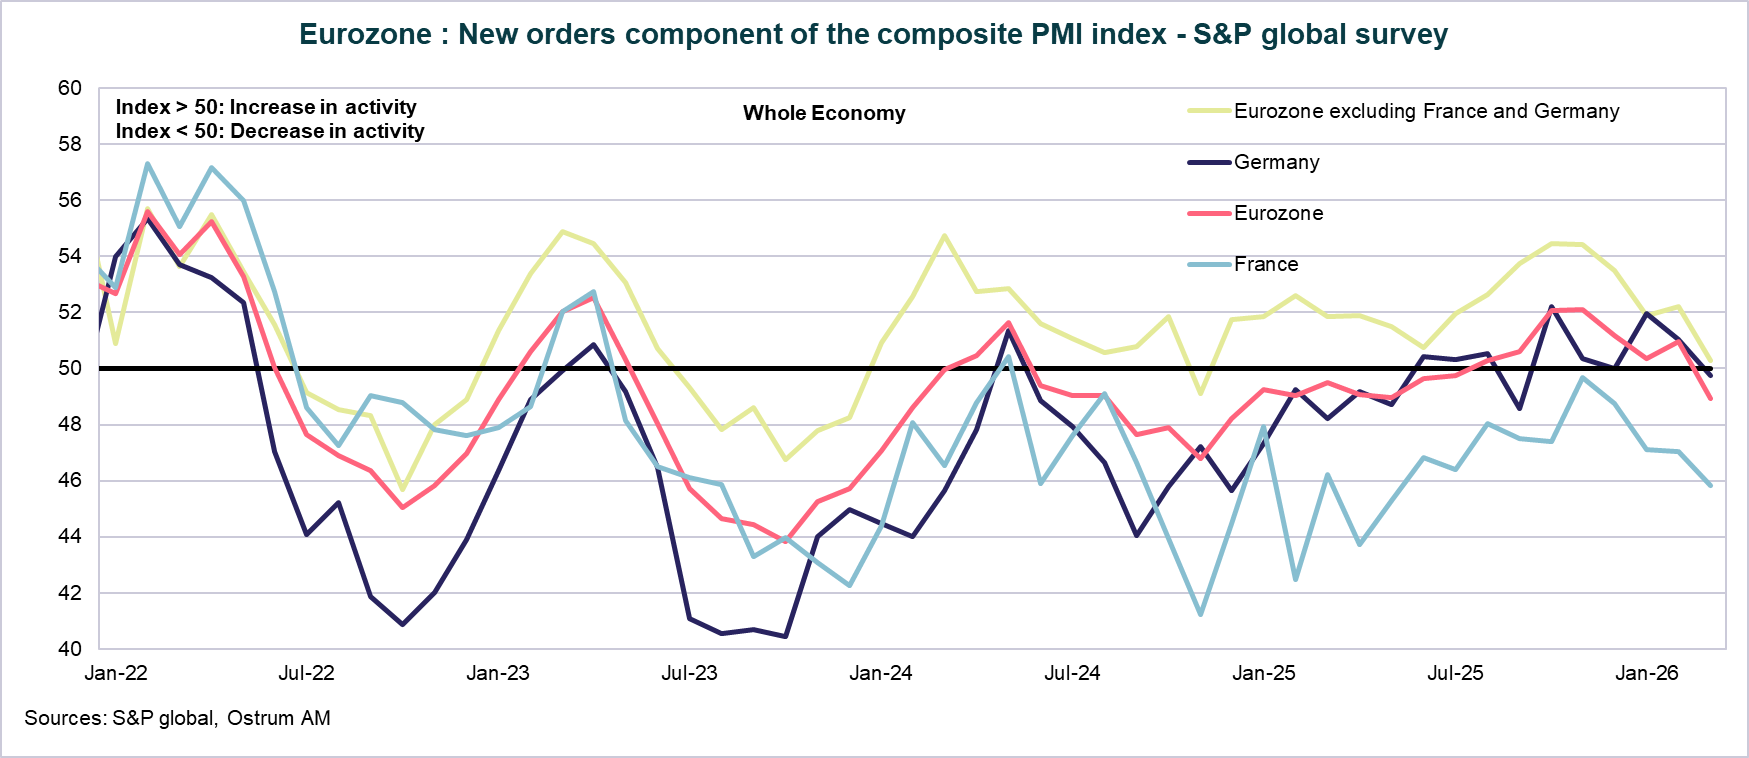
The S&P Global survey is conducted among business leaders. In March, the composite PMI index moderated to 50.5 from 51.9 in February. The index is just above the 50 threshold, signaling a slight increase in activity. Demand addressed to business leaders fell for the first time in 7 months. The euro area new orders index is below 50: 48.5, the lowest since December 2024.
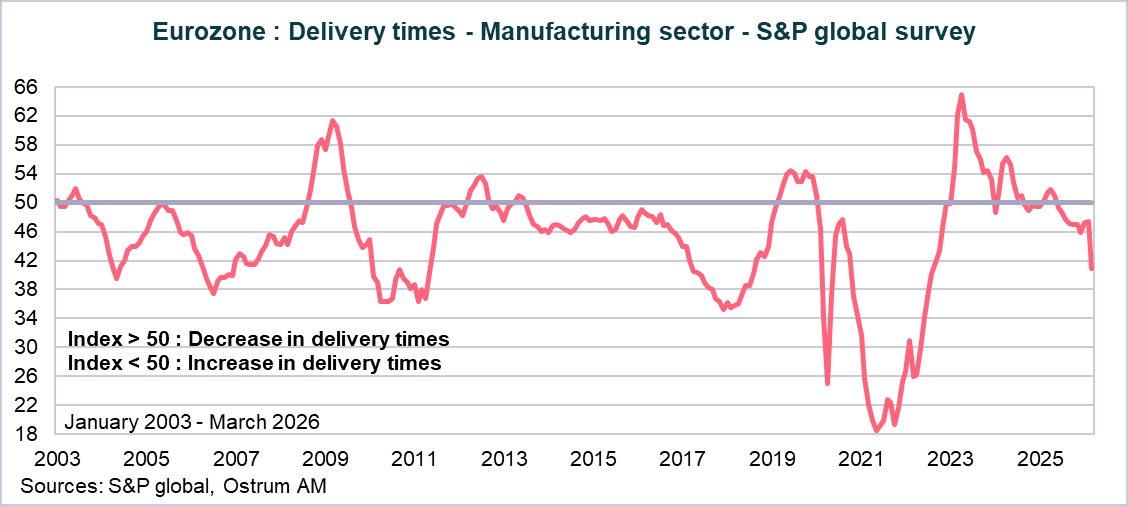
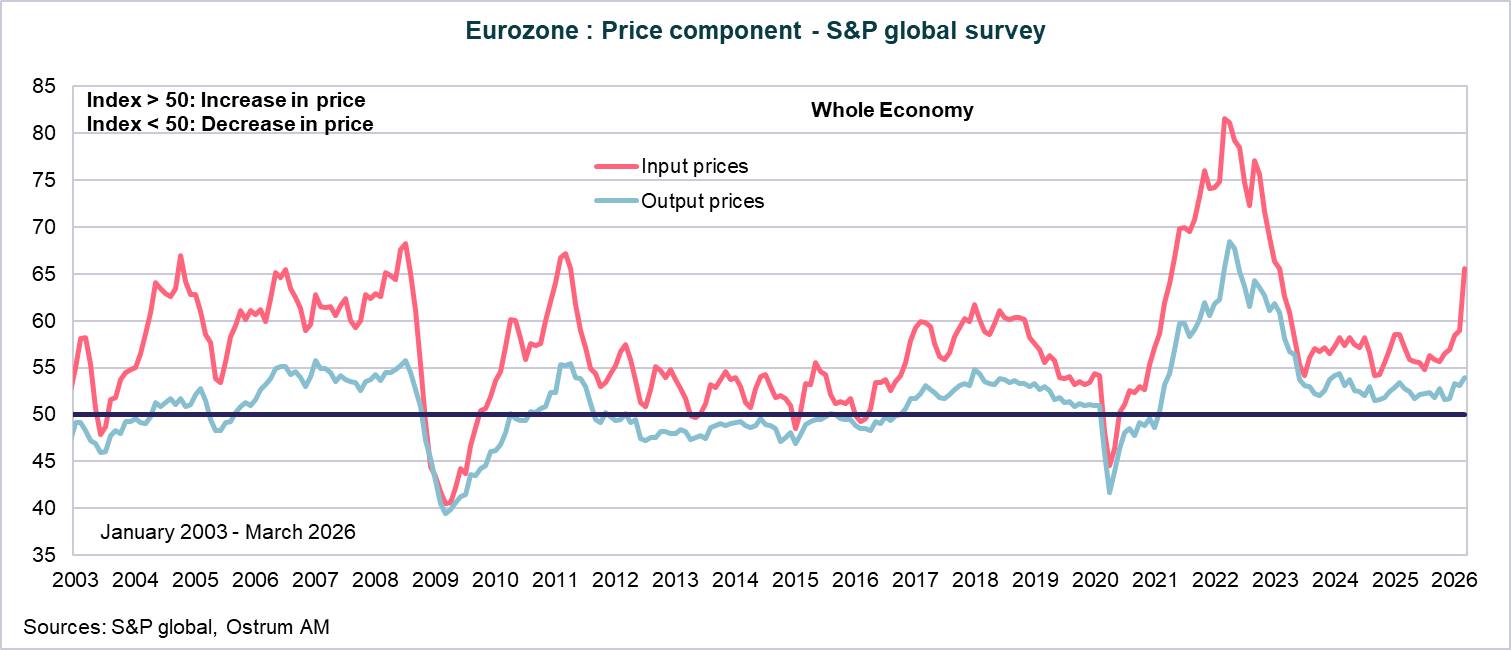
Sharp rise in delivery times and input prices.
In the manufacturing sector, delivery times have increased significantly (the scale is inverted on the graph), reaching August 2022 levels. The rise in energy prices is reflected in the increase in input prices, with the index rising by nearly 11 points to reach a high since October 2022. For now, this is not being passed on to selling prices, as evidenced by the near stability of output prices. This survey suggests that business leaders are absorbing the rise in energy prices into their margins at this stage.
European Commission Survey
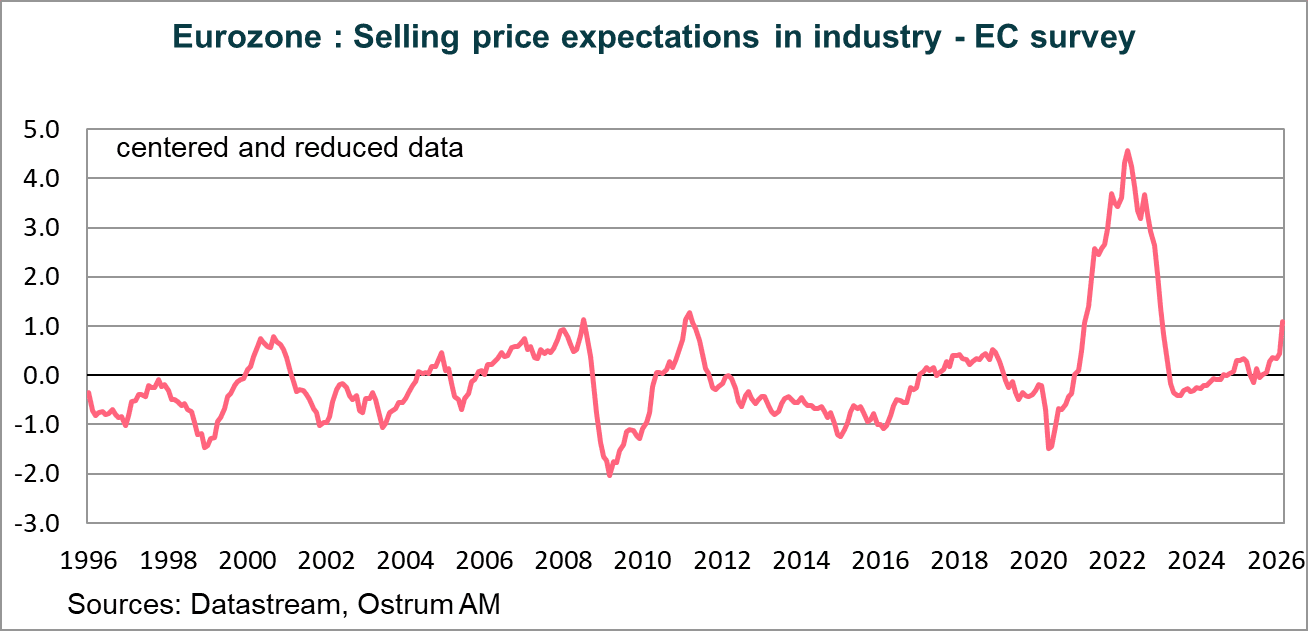
Soaring selling price expectations in industry.
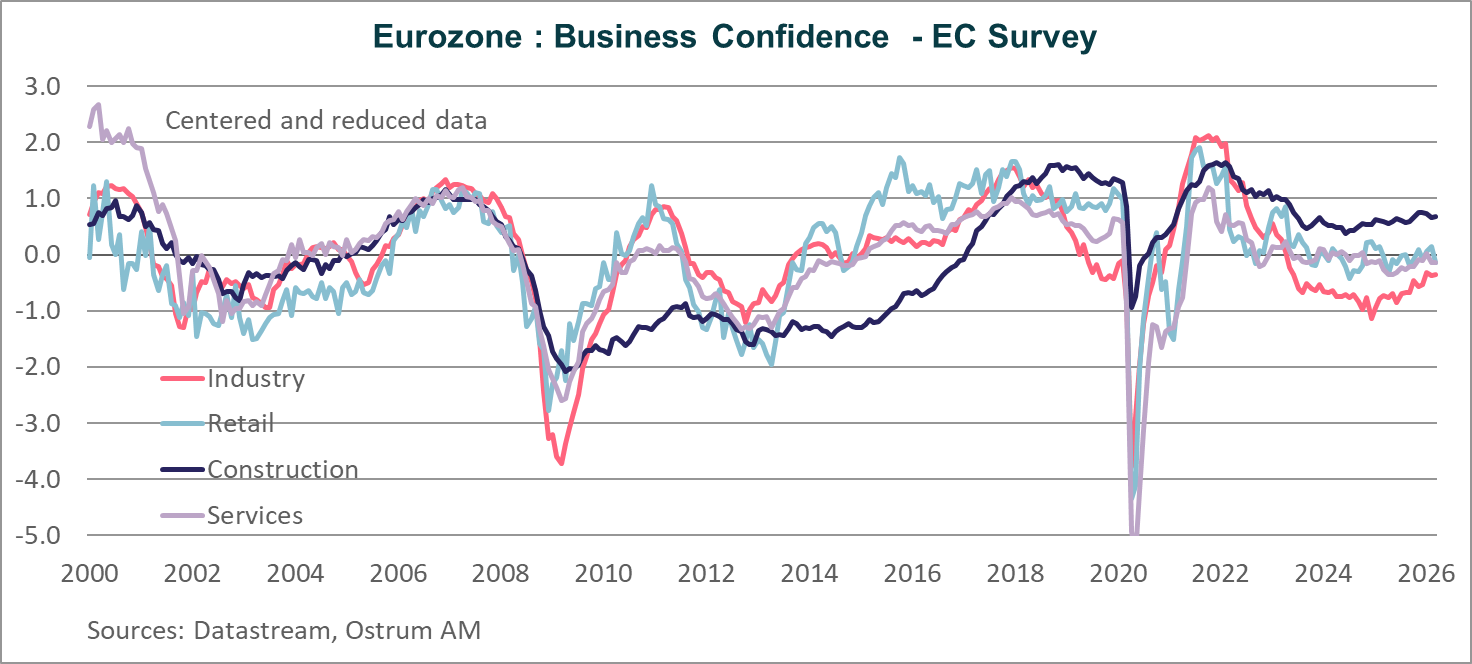
Business confidence remained relatively unchanged in March according to the EC survey. The index is oscillating around its long-term average in retail trade and services (0 on the graph), stabilizing above it in construction, and remaining below its long-term average in industry.
This apparent stability masks an increase in 3-month selling price expectations from business leaders, particularly strongly in industry. These soared in March, settling well above their long-term average and at a high since February 2023. However, we are still far from the peak of April 2022.
Survey of Households
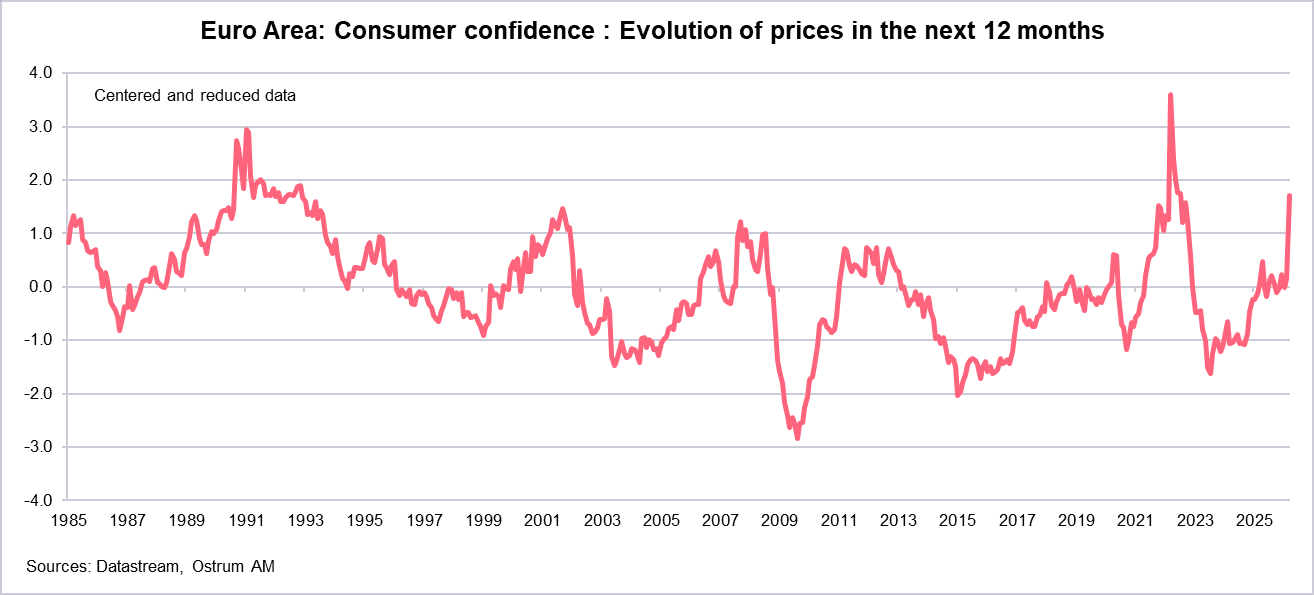
Sharp rise in household inflation expectations for 1 year...
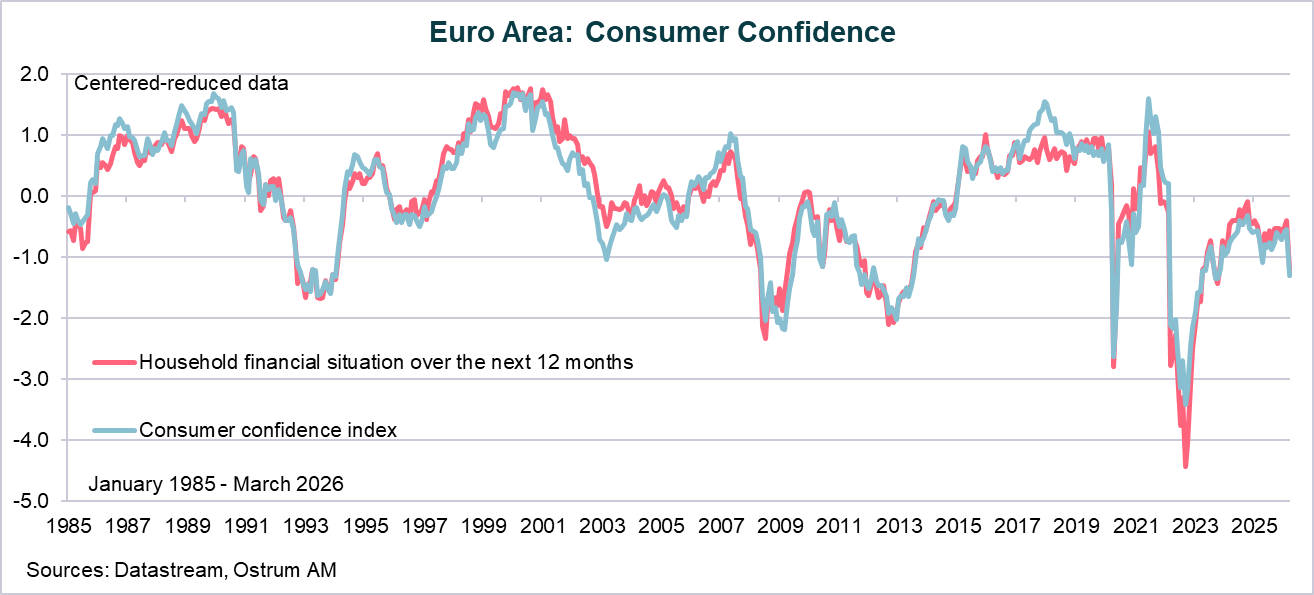
The EC survey revealed, unsurprisingly, a sharp decline in euro area household confidence. The index is well below its long-term average. Households anticipate a deterioration in the economic situation and their financial situation over the next 12 months. This is due to a sharp rise in household price expectations over the next 12 months. The index is well above its long-term average and at a high since July 2022.
... while household inflation perception remains high: 3% in February.
The ECB's survey on household expectations did not incorporate the consequences of the energy shock, given that 97% of responses were collected before the outbreak of the conflict in Iran. 1-year and 3-year inflation expectations moderated slightly in February to 2.5%, and 5-year expectations remained stable at 2.3%. A point of attention arises from the fact that households' inflation perception remains high: 3% in February, despite the moderation of prices to 1.9% in February 2026. This household inflation perception has not returned to the 2% levels that prevailed before the strong post-Covid recovery (before July 2021).
What do the markets say?
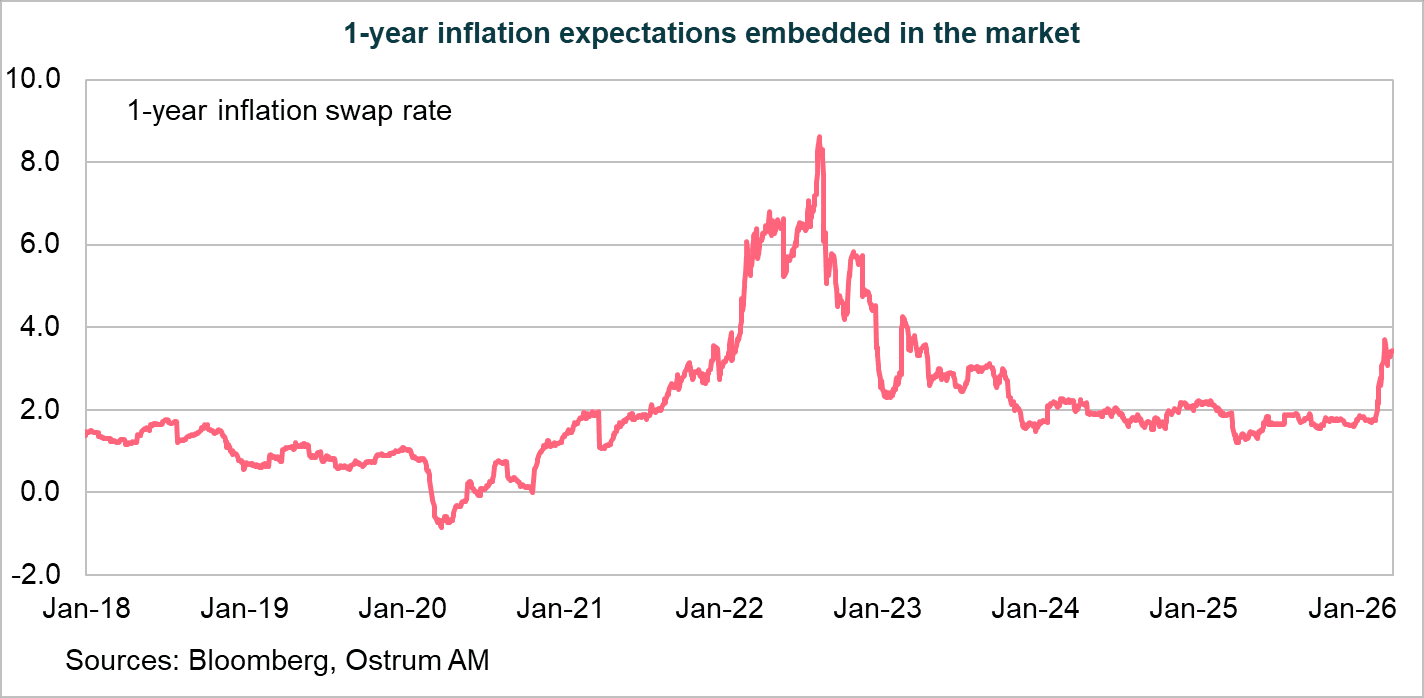
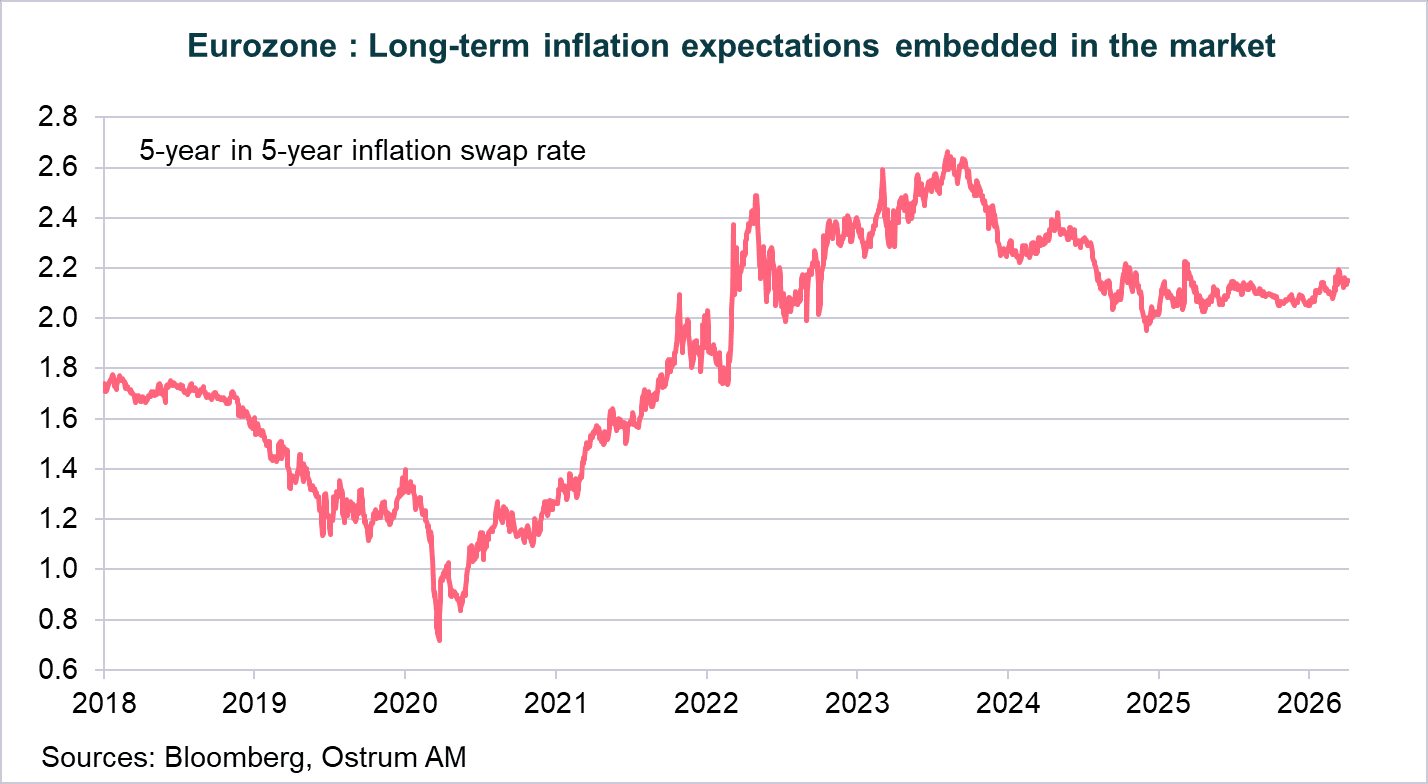
Long-term inflation expectations remain well-anchored.
Short-term inflation expectations embedded in the market rose sharply following the outbreak of the conflict in Iran. The one-year inflation swap rate went from 1.8% on February 27th to a peak of 3.70% on March 19th, before returning to 3.40% today. This shock is not perceived as persistent by the markets, unlike in February 2022. Long-term inflation expectations, as measured by the 5-year, 5-year inflation swap rate, have remained well-anchored, evolving between 2.1% and 2.2%, unlike in 2022.
Conclusion
The first signs of the effects of rising energy prices are beginning to be seen through inflation figures and surveys. Households anticipate a sharp rise in inflation over one year, and business leaders anticipate an increase in their selling prices over the next 3 months. This comes at a time when households' inflation perception remains high (3% in February). The ECB fears that the recent memory of inflation could generate second-round effects (impact on wages). In her speech on March 25th, Christine Lagarde indicated that if the energy shock resulted in a significant but not too persistent overshoot of the inflation target, an adjustment in monetary policy could be justified, especially as failing to react could pose a communication risk. “The optimal response to such a deviation is smaller when the cause is exogenous supply disruptions rather than strong demand, but it is not necessarily zero”. Given all these factors, the sharp rise in energy prices should lead the ECB to raise its rates as early as June to demonstrate its unconditional determination to bring inflation back to 2% in the medium term.
Aline Goupil-Raguénès
Chart of the week
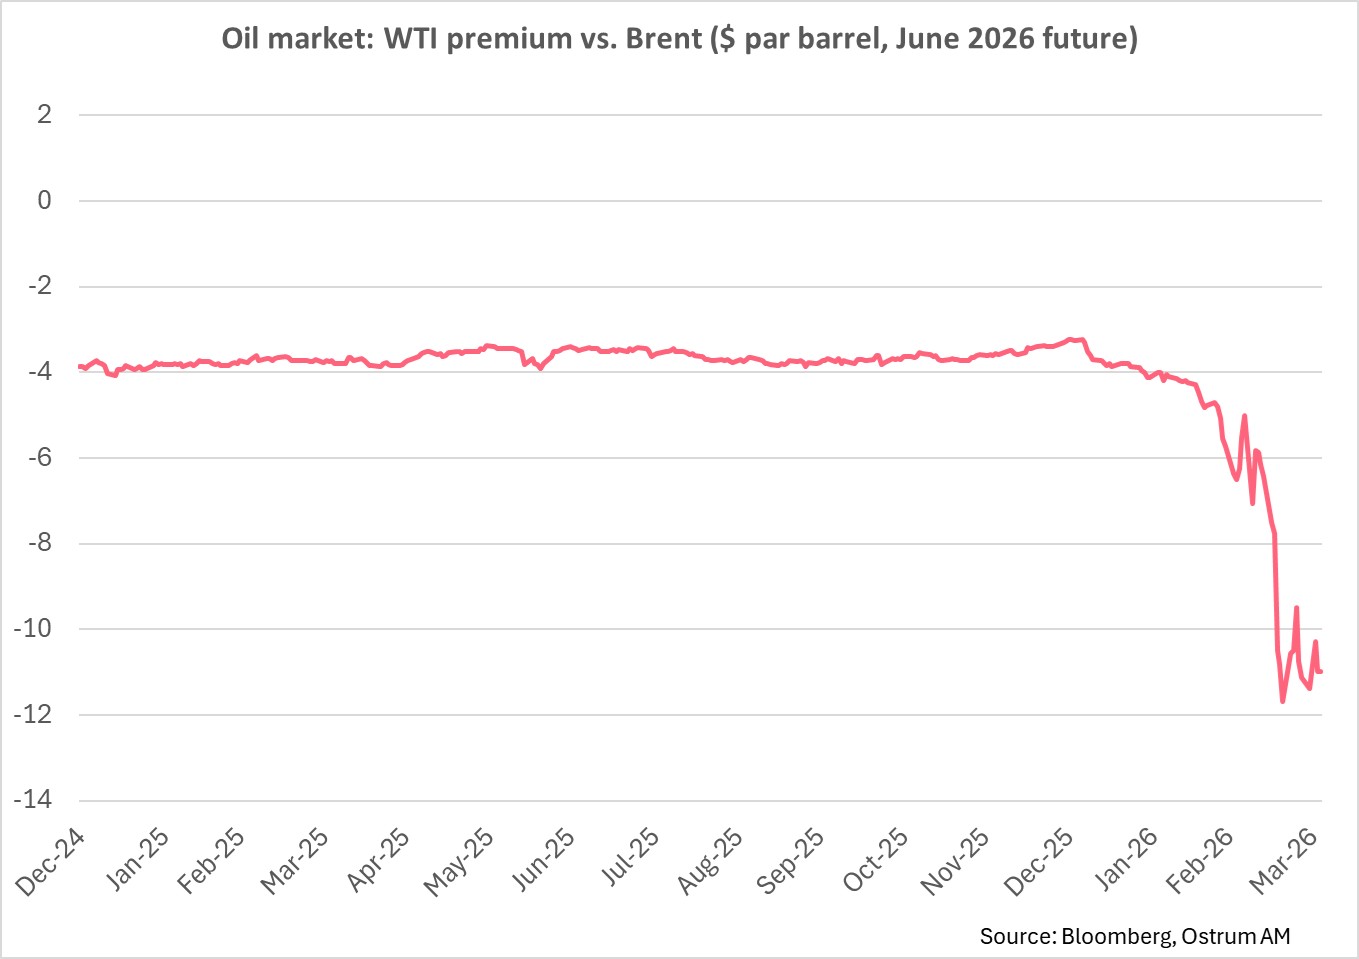
The U.S. WTI is trading $10 below its European equivalent, according to June 2026 contract prices. U.S. WTI is trading around $98 for delivery at the end of June, while Brent – the international benchmark – is trading around $108. This price differential between these two similar quality light oils reflects the geopolitical risk premium borne by Europeans, knowing that Asia is even more dependent on crude oil exports from the Gulf, and on oil from Oman or Dubai. A potential halt to the conflict would significantly reduce this premium on Brent.
Figure of the week
40.7
Investor withdrawal requests from the Blue Owl Technology Income Corp fund significantly increased in the first quarter, representing 40.7% of the fund's value. They were limited to only 5%.
Market review:
- Iran: Trump gives himself two to three weeks to end the conflict;
- United States: Employment up by 178k with the jobless rate falling to 4.3%; however, the data is inconsistent;
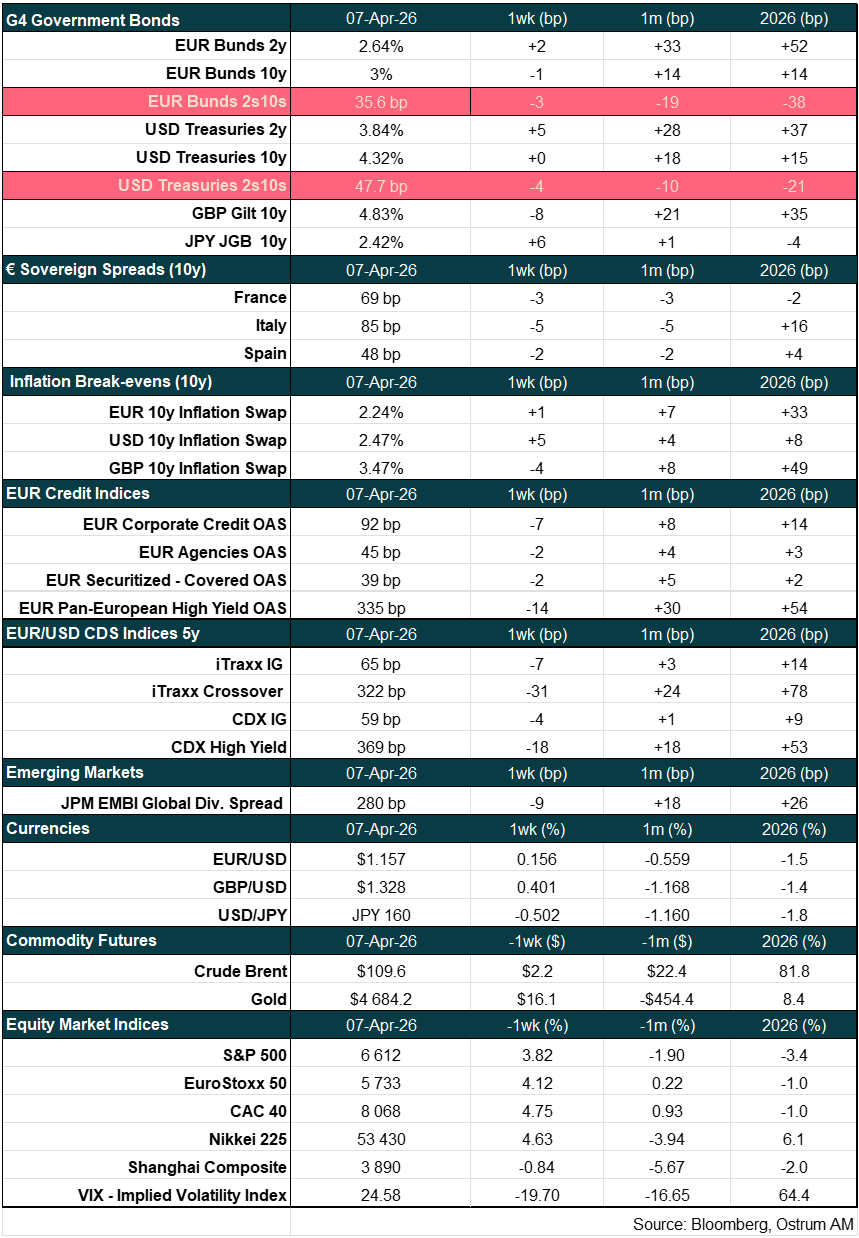
- Bonds: The T-note settles at 4.35% and the Bund at 3%;
- Equities: Stock markets rebound ahead of the Easter long weekend.
Trump Seeks an Exit Strategy
The conflict drags on with no clear resolution in sight. American pressure has failed to deliver solutions, though volatility is moderating somewhat in otherwise disoriented markets.
Donald Trump's latest address offered no clear roadmap for ending the conflict. A ground intervention remains possible, with the U.S. continuing to pound Iranian targets while Tehran retaliates by striking infrastructure across several Gulf states. Nevertheless, market volatility has shown signs of abating. Yields are oscillating around 4.30% in the U.S. (10-year Treasury) and 3% in Germany (Bund). Credit spreads have stabilised, with CDS indices showing significant tightening (the iTraxx Crossover down 35 basis points). Equities have recovered 2-3% over the week. The dollar continues to serve as a haven asset, while currencies distant from the conflict—such as the Brazilian real or Australian dollar—offer attractive diversification.
The Iran war dictates the oil narrative and, by extension, market sentiment. Economic releases inevitably appear dated, though early March data has begun to emerge. Eurozone inflation rose as expected to 2.5% in March, driven by energy price contributions. Core inflation, however, came in below expectations at 2.3%. Beyond oil, food price developments warrant attention given rising fertilizer costs. Surveys suggest a relative price shock rather than a sustained inflationary episode. The term structure of inflation expectations indicates above-3% inflation throughout the year, followed by a return to the 2% target the following yea. Nevertheless, the ECB will be compelled to act on rates to preemptively curb inflation expectations. In the U.S., labor market data appears inconsistent. March's 178,000 job gains must be viewed alongside February's downward revision (-133,000) and the household survey's estimate of a 64,000 decline last month. The unemployment drop stems entirely from falling participation rates. Involuntary part-time work is rising and hours worked are declining. Average hourly earnings have slowed to 3.5% year-on-year. The manufacturing ISM reports input price pressures (energy, aluminum, memory chips), though activity appears to be improving as the Trump administration prepares to impose new tariffs on pharmaceuticals, aluminum, and copper.
Markets appear to be acclimatizing to this toxic environment. The 10-year Treasury oscillated around 4.35% at week's end in thin Good Friday volumes. Equity markets rallied on short-covering ahead of a long weekend that may be marked by fresh Iranian strikes. Jerome Powell appears intent on buying time, emphasizing stable inflation expectations. The Fed well understands it should not react to temporary supply shocks, but memories of 2022 heighten the risk of expectation drift. The Bund sits at 3%. Sovereign spreads have eased, though the BTP remains wider than the OAT given Italy's greater gas exposure. Corporate credit is stable, with most volatility concentrated in equity indices. Stocks have rebounded, particularly financials and utilities in Europe.
Axel Botte
Main market indicators