Read our market review and find out all about our theme of the week in MyStratWeekly and its podcast with our experts Axel Botte, Aline Goupil-Raguénès and Zouhoure Bousbih.
Listen to podcast (in French only)
(Listen to) Axel Botte’s and Aline Goupil-Raguénès’ podcast:
- Review of the week – Markets declare war over;
- Theme – The EU's reliance on natural gas imports is back in the spotlight.
Podcast slides (in French only)
Download the Podcast slides (in French only)Topic of the week: The EU's reliance on natural gas imports is back in the spotlight
- Since the outbreak of the conflict in Ukraine, the EU has significantly reduced its imports of Russian gas in favor of American liquefied natural gas. Norway, the EU's top gas supplier, is thus closely followed by the United States;
- US LNG imports are expected to increase significantly with the EU's ban on importing Russian gas by September 2027 and the trade agreement signed between the United States and the EU last July. The latter foresees EU purchases of $750 billion over 3 years of American oil, LNG, and nuclear fuels;
- Furthermore, global LNG export capacities are set to significantly increase by 2030 with ongoing projects, primarily driven by the United States (50%) and Qatar (19%). However, Iranian strikes on Qatar's gas infrastructure are expected to affect some projects;
- There is a risk that some investment could become stranded assets, depending on the speed of renewable energy adoption and the achievement of the net-zero CO2 emissions target by 2050;
- Becoming excessively dependent on American natural gas is not desirable from an energy security perspective. The EU must diversify its supply sources and, above all, invest more in renewable energies to achieve climate neutrality by 2050 and ensure its energy sovereignty.
The EU's energy mix consists mainly of fossil fuels
Oil and oil products account for 38% of the EU's energy mix, gas for 21%, and coal for 8%.
Energy available within the EU primarily comes from imports: 57% in 2024 according to Eurostat, with the EU producing 43% of its own energy (of which 48% is renewable energy). The energy mix, meaning the different energy sources available within the EU, consists first and foremost of oil and oil products (38%), followed by natural gas (21%), and renewable energies and biofuels (20%). Nuclear energy and solid fuels (including coal) represent 12% and 8% respectively of the EU's energy mix in 2024.
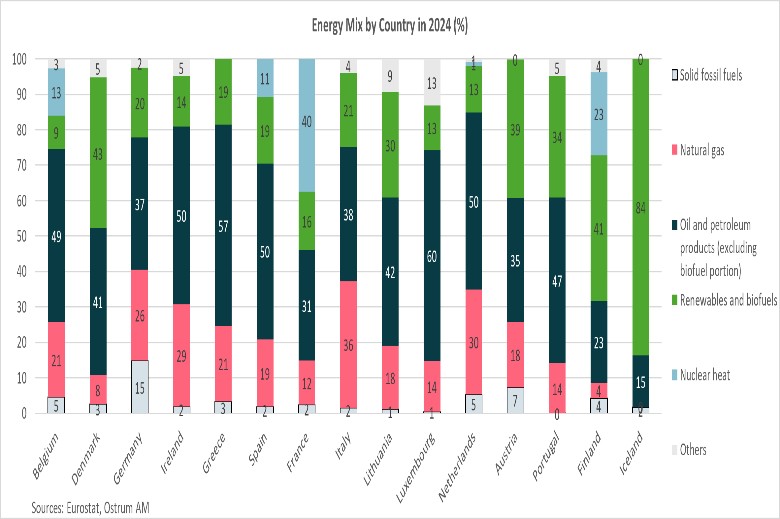
Italy relies more heavily on natural gas, France stands out due to the importance of nuclear power, and Finland and Iceland have an energy mix composed mainly of renewable energies.
As we observe in the accompanying graph, there are significant disparities between countries. For example, Italy is more dependent on natural gas (at 36%), followed by the Netherlands, Ireland, and Germany. France stands out due to the importance of nuclear power (40% of its energy mix), which allows it to be less exposed to oil and gas. Finally, Finland and Iceland benefit from low dependence on fossil fuels due to the significant share of renewable energies, which represent 41% and 84% of their respective energy mixes.
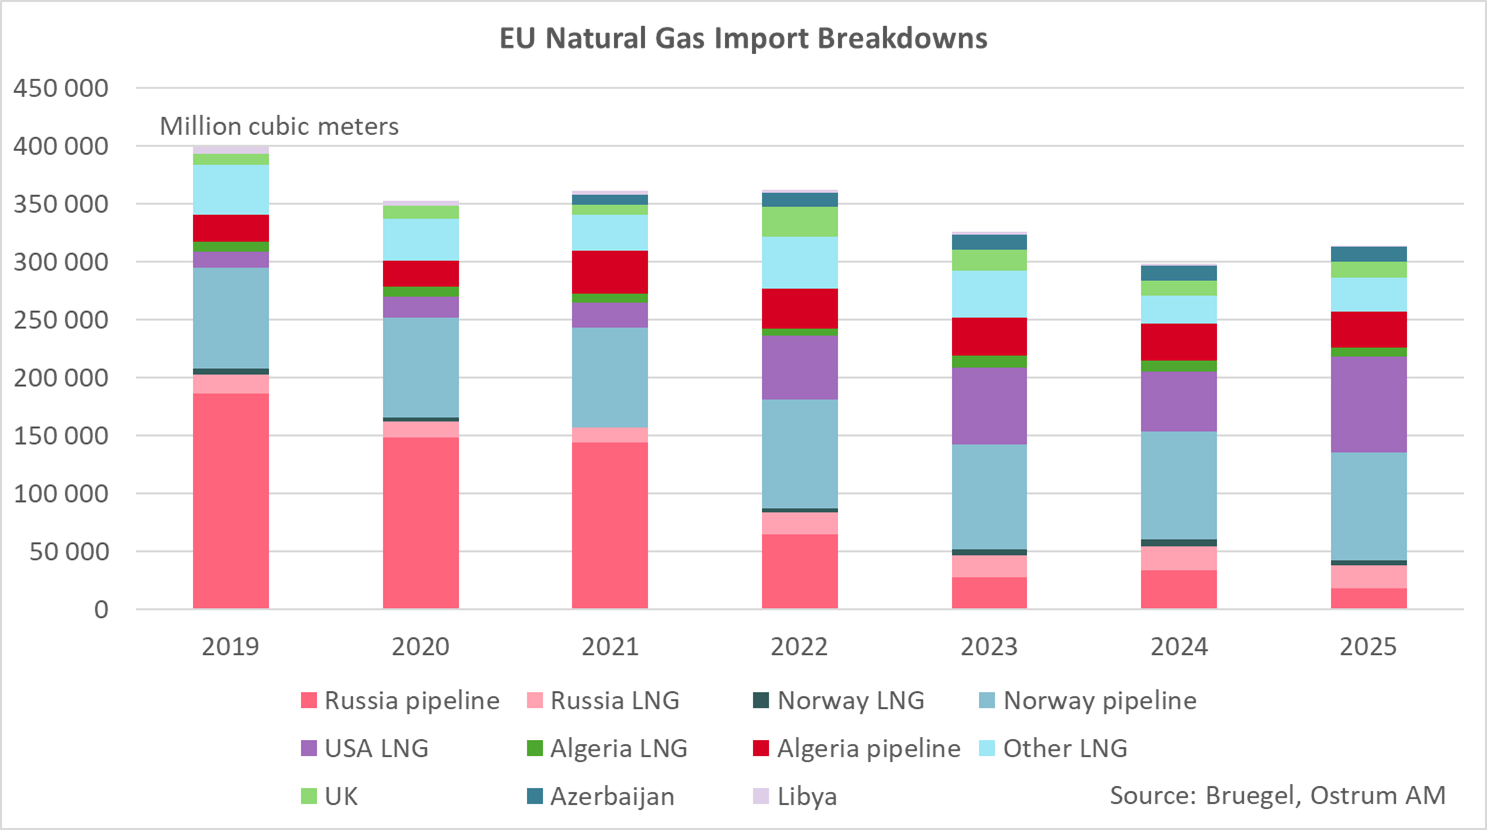
Marked reduction in Russian gas imports
Before the outbreak of the war in Ukraine, the EU's dependence on Russian gas imports was significant: 43% of the EU's gas imports came from Russia in 2021. The gas was essentially transported by pipeline (at 80%). With the war in Ukraine, the EU had to rapidly and sharply reduce this dependence. By 2025, Russian gas imports represented only 8% of the EU's total gas imports, with half coming by pipeline and the other half by liquefied natural gas.
By the end of September 2027, the EU will no longer import Russian gas, and measures will be taken to ban Russian oil imports by the end of 2027.
This trend is set to continue. An agreement was reached within the EU in December 2025 to ban imports of Russian liquefied natural gas starting in early 2026, upon the regulation's entry into force, and pipeline imports from September 30, 2027. The agreement also includes a ban on Russian oil imports by the end of 2027.
Norway is the EU's leading gas supplier (31% of imports), closely followed by the United States (26%).
Faced with the significant drop in Russian gas imports, the EU sought other supply sources. This resulted in a sharp increase in liquefied natural gas imports from the United States. Their share in the EU's total gas imports rose from 6% in 2021 to 26% in 2025. US LNG imports thus represent 60% of the EU's total LNG imports. The share of gas imports from Norway also increased, rising from 24% in 2021 to 31% in 2025. Norway has become our leading gas supplier, closely followed by the United States. The share of gas from Algeria remained stable over the period, accounting for 12% of EU imports.
Low EU dependence on gas from the Middle East
Nearly 20% of global gas exports transit through the Strait of Hormuz (19% in 2025). This is primarily due to Qatar: 112 billion cubic meters exported in 2025. It is the second-largest global exporter. The United Arab Emirates exported 7 billion cubic meters in 2025. Nearly 90% of liquefied natural gas exports transiting through the Strait of Hormuz are destined for Asia, and just over 10% for the EU.
Qatar's share of European gas imports is limited, representing 3.8% overall and 8% for LNG.
The EU's dependence on gas from Middle Eastern countries is therefore limited. The share of European gas imports from Qatar is only 3.8% in 2025, and 8% for LNG imports. The conflict, however, has a global impact on energy prices, particularly natural gas prices, affecting all countries.
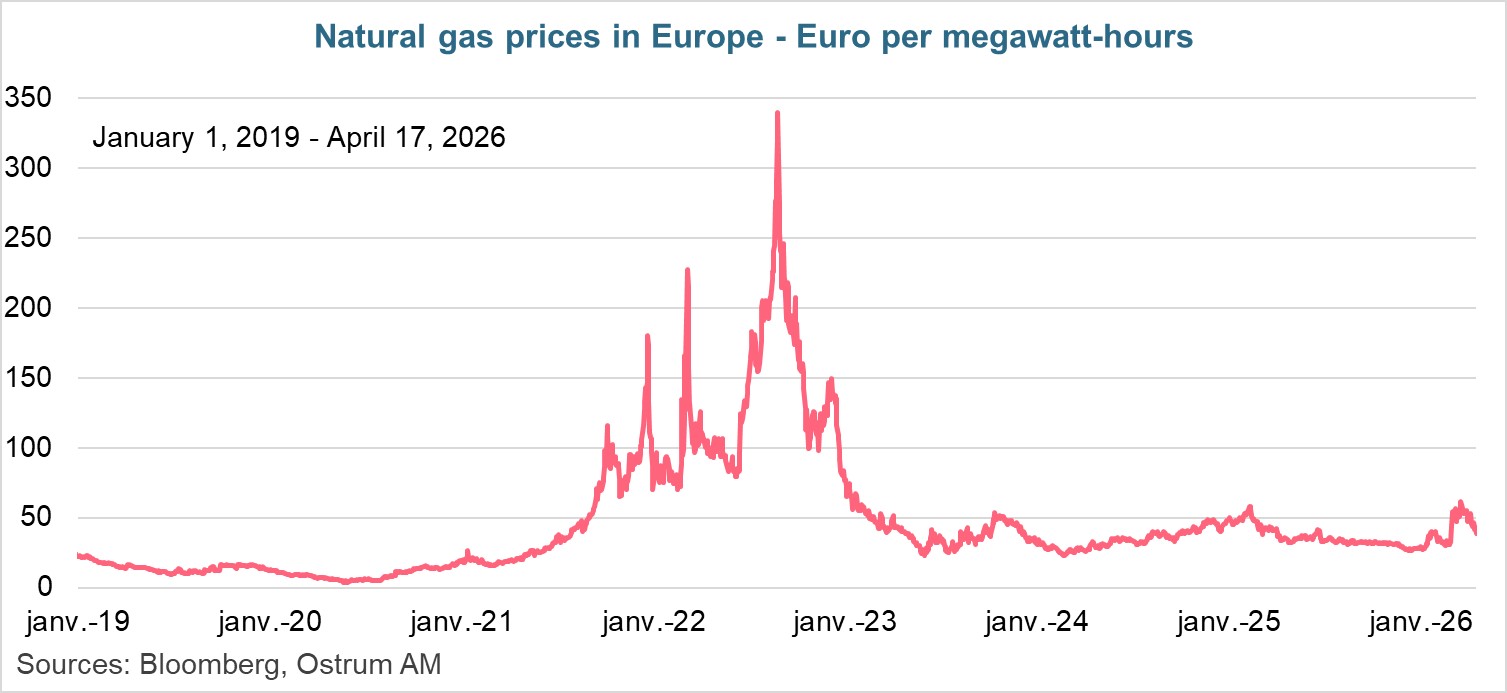
Between February 27, before the conflict in Iran, and March 19, European natural gas prices increased by 93%, rising from €32/MWh to €61.9/MWh. Since then, gas prices have moderated, returning to €38.8/MWh on April 17, as investor fears somewhat subsided following the ceasefire and talks between the United States and Iran. This is far from the €340/MWh level reached in late August 2022, when Europe had to quickly wean itself off Russian energy on which it was heavily dependent.
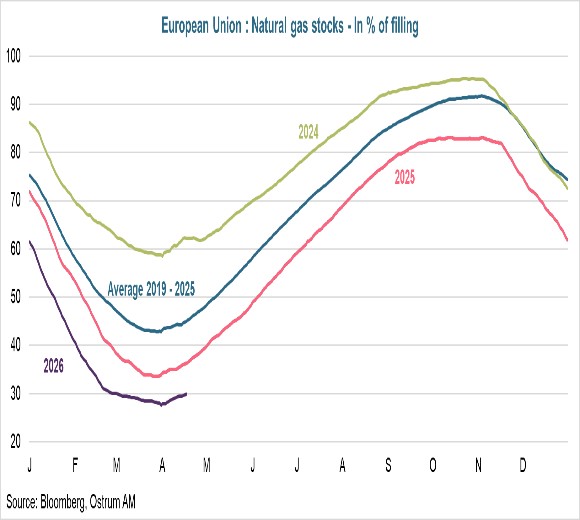
These tensions on natural gas prices come at a time when stocks are low for this period of the year. Storage capacities are only filled to 30%, well below the 45% average recorded in mid-April from 2019 to 2025. To fill storage capacities before winter, Europe will find itself competing with Asian countries for LNG supply, especially as the latter are greatly affected by the near blockade of the Strait of Hormuz. In the absence of improved maritime traffic, natural gas prices are expected to remain high.
Towards greater dependence on American LNG
The EU has committed to increasing its energy imports from the United States
If the EU abides by the trade agreement signed with the United States in July, it will have to purchase $750 billion worth of American oil, LNG, and nuclear fuels over 3 years by 2028.
On July 27, 2025, the EU concluded an unbalanced trade agreement with the United States to cap American customs duties on European products at 15%. Donald Trump had threatened the EU with reciprocal tariffs of 20% on April 2, 2025, before escalating this threat to 30% in early July. This agreement notably provides for a significant increase in EU energy supplies originating from the United States. It mandates EU purchases of $750 billion over 3 years of American oil, LNG, and nuclear fuels. Of the average $250 billion to be purchased annually, the EU already imports between $90 and $100 billion per year of these energy sources from the United States. This will translate into a sharp rise in US LNG supplies, even though it already accounts for 60% of the EU's total LNG imports. According to the Institute for Energy Economics and Financial Analysis, if the EU adheres to this agreement, US LNG imports could represent 82% of the EU's LNG imports by 2030.
Towards a substantial rise in LNG export capacity by 2030
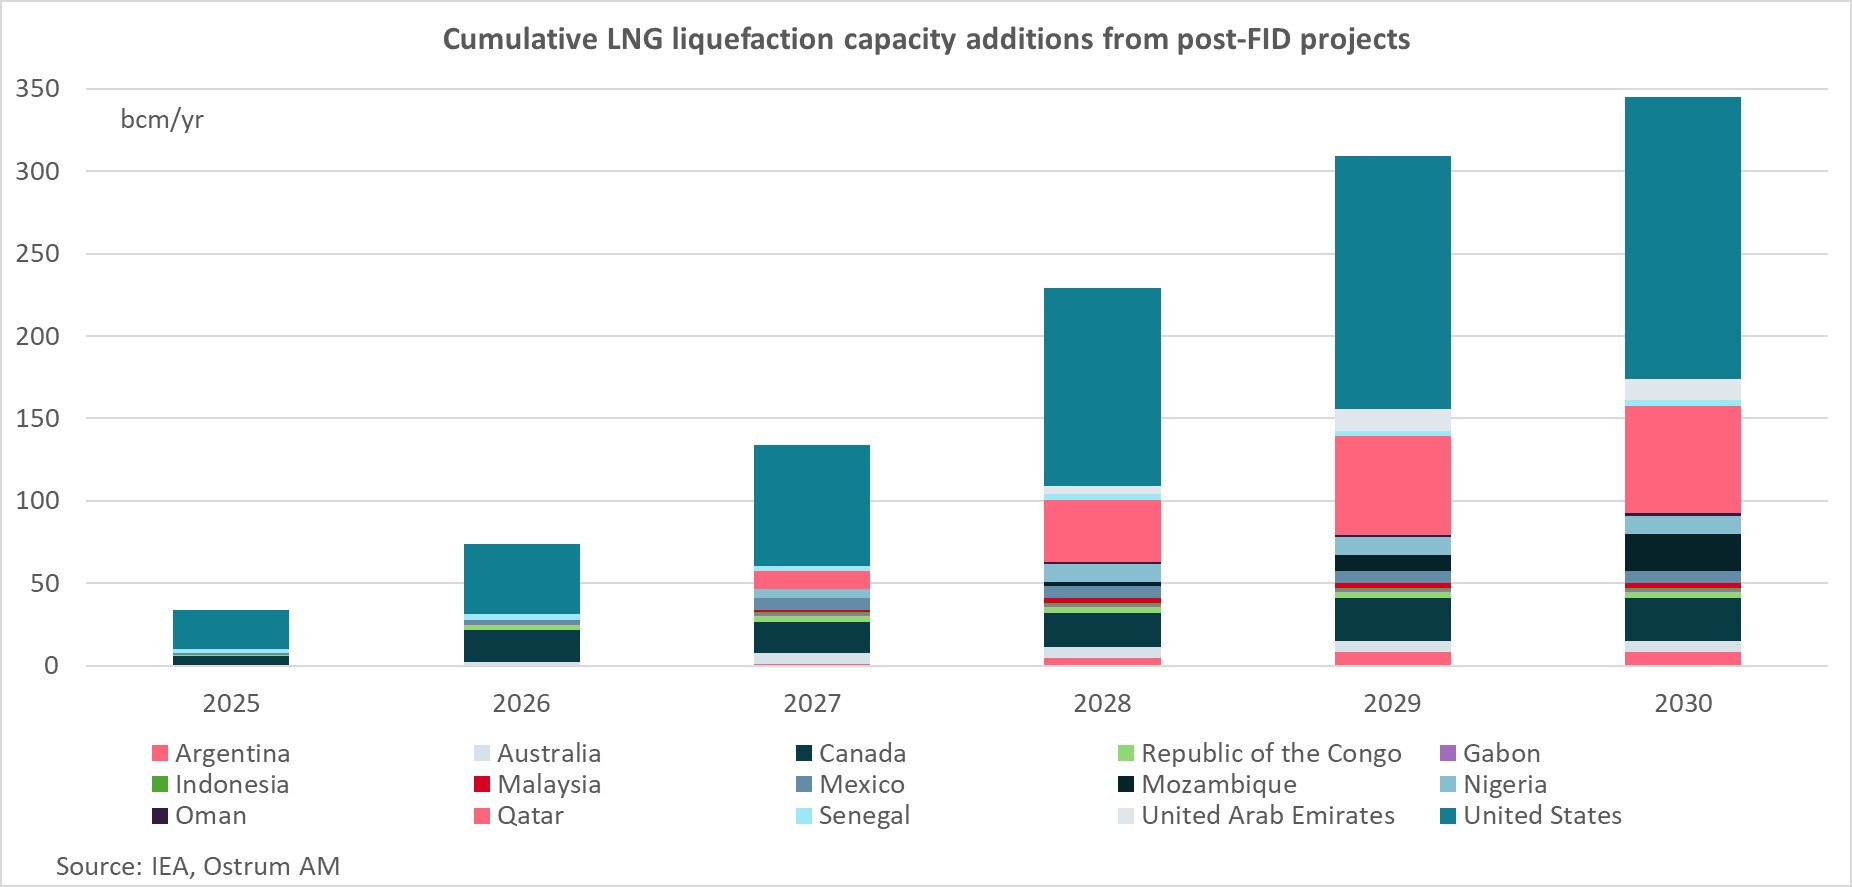
Between 2025 and 2030, approximately 345 billion cubic meters per year of new LNG export capacity is expected to be brought online, with 50% of that in the United States.
Over the coming years, global LNG export capacities are set to increase significantly, as shown in this graph. Between 2025 and 2030, approximately 345 billion cubic meters per year of new LNG export capacity is expected to be brought online, thanks to projects that have already reached final investment decisions and are under construction in 2025. These projects are located 50% in the United States and 19% in Qatar.
These figures must, however, be put into perspective by the conflict in the Middle East. Iranian strikes on the world's largest gas liquefaction plant: Ras Laffan in Qatar, have destroyed nearly 20% of the gas facilities, and their reconstruction could take between 3 to 5 years.
Towards a risk of stranded assets?
The question is whether these new export capacities will meet new needs, which would make the investments profitable, or if some of these projects will no longer be necessary due to the upcoming decrease in demand. To answer this question, we can refer to the latest World Energy Outlook 2025 report from the International Energy Agency and its three selected scenarios.
In the IEA scenario based on current policies, the rise in global LNG demand by 2030 will allow for the absorption of the increase in LNG export capacities.
The first scenario is based on current policies (CPS: Current Policies Scenario).. It relies on existing policies and regulations and assumes no new climate or energy measures, nor does it reflect announced commitments (a perspective of inertia regarding the deployment of new energy technologies and their integration into the energy system). In this scenario, global LNG demand is projected to increase by 260 billion cubic meters between 2024 and 2030, which will allow for the absorption of the increase in LNG capacities during this period, as shown by the red curve in the graph below. China, Japan, and Europe will absorb nearly half of the LNG supply increase by 2030. By 2035, approximately 20 billion cubic meters per year of additional LNG export capacity will be needed beyond what currently exists and what is under development. Existing and Under Construction LNG Export Capacities and LNG Trade by Scenario to 2035 – In billion cubic meters.
Existing and Under Construction LNG Export Capacities and LNG Trade by Scenario to 2035 – In billion cubic meters
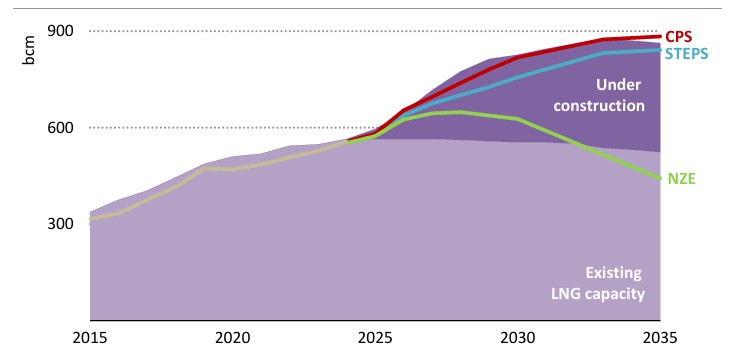
CPS = Current Policies Scenario, STEPS = Stated Policies Scenario; NZE = Net Zero Emission by 2050 Scenario. Sources: IEA, Ostrum AM
In the IEA's stated policies scenario, global gas demand is not sufficient to absorb all new LNG capacities. It will only be sufficient after 2035.
The IEA's second scenario is the Stated Policies Scenario (STEPS). It assumes a broader implementation of policies, including those that have been officially proposed but not yet adopted, as well as other official documents indicating a direction. STEPS does not assume that ambitious goals will be met. In this scenario, LNG demand is projected to increase by 200 billion cubic meters between 2024 and 2030. This is lower than the growth in available LNG export capacity, which exerts downward pressure on LNG prices, bringing them closer to short-term marginal costs. Stronger growth in renewable energies, increased electrification, and faster efficiency gains in STEPS lead to greater displacement of LNG in China and Europe. This frees up relatively cheap LNG for price-sensitive consumers in other economies, particularly in India and other South Asian regions, but, given their stated policies and ongoing efforts to electrify and deploy renewable energies, the increase in demand from these consumers is not sufficient to absorb the entire remaining wave of new LNG supply. This results in an excess of available LNG capacity of approximately 65 billion cubic meters in 2030. The surplus is gradually absorbed by 2035. This is represented by the blue curve on the graph.
In the IEA's "Net Zero Emissions" scenario, overall utilization of LNG export capacities would fall to 75% in 2030 and 50% in 2035.
The third scenario is the "Net Zero Emissions by 2050 Scenario." It takes a different approach, outlining a pathway to reduce CO2 emissions to achieve net-zero by 2050, while acknowledging that each country will adopt its own trajectory. In the NZE Scenario, the sharp decline in global natural gas demand means that many LNG projects currently under construction would no longer be necessary. If they were to proceed, overall capacity utilization would fall to 75% in 2030 and 50% in 2035, and several facilities would likely be decommissioned or repurposed for the trade of hydrogen-based fuels such as ammonia or methanol. (Green curve on the graph).
Therefore, there is a risk that some projects could become stranded assets, depending on the speed of renewable energy adoption and the achievement of greenhouse gas reduction targets: net-zero CO2 emissions by 2050. In Scenario 2, some projects will not encounter sufficient demand for 10 years, and in Scenario 3 (net-zero emissions by 2050), a significant portion of projects will become stranded assets due to the decline in LNG demand linked to achieving climate neutrality by 2050.
Conclusion
In a short period, the EU has succeeded in moving away from Russian energy by significantly increasing its imports of American LNG. This dependence is expected to grow further in the coming years, given the complete halt of Russian gas imports, the EU's commitments to the United States regarding energy imports, and the substantial upcoming increase in American export capacities. Becoming excessively dependent on American LNG imports is clearly not desirable, as energy could become a means of pressure by the White House, as customs tariffs recently have been. The EU must diversify its supply sources and, above all, increase the share of renewable energies in its energy mix to ensure its energy sovereignty.
Aline Goupil-Raguénès
Chart of the week
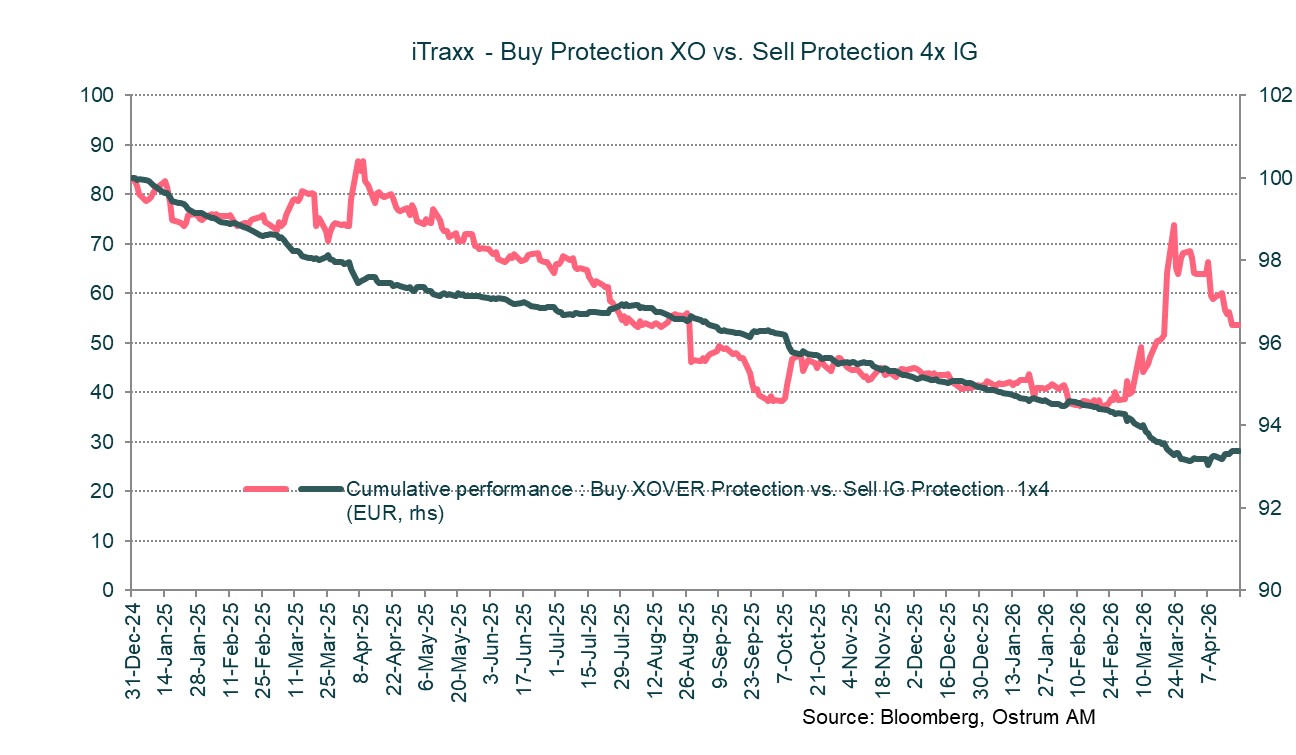
The war in Iran triggered portfolio reallocations and credit risk hedging flows. Protection buying using iTraxx XOVER was significant among end users and market makers. The rise in iTraxx XOVER spreads proved more pronounced than the widening of IG spreads, even when adjusting for relative risk (1x4 ratio). The rebound in risk assets should now induce a new phase of compression in the rating-based structure of credit spreads. The resumption of risk appetite could thus bring the weighted spread back to the low levels of late February 2026
Figure of the week
5.2
5.2 million barrels per day is the estimate for US crude oil exports the week of April 10th, compared to an average of 4 mb/d in Q1.
Market review:
- War: Iran declared strait of Hormuz open on Friday but the strait closed again during the weekend;
- China: Q1 Growth at 5% thanks to trade balance;
- Equities: rebound extended by bank earnings releases and tech stocks;
- Rates: inflation risk premiums fall in keeping with plunging oil prices on Friday.
Markets Declare War Over
Quarterly earnings releases and hopes for Middle East deescalation are amplifying the equity rebound and spread tightening. Friday's announcement of the reopening of the Strait of Hormuz sent markets even higher.
Financial markets appear to have sidestepped the war entirely. In equity markets, microeconomics has reasserted itself over the international environment and broader economic conditions. Early earnings releases are meeting elevated expectations for roughly 15% EPS growth in the United States. Technology stocks—particularly in the wake of TSMC's results—are driving indices higher. Term premiums on long-term rates are compressing. The Bund has dropped back below 3%, while the T-note is approaching 4.20%. Credit spreads have already returned to pre-Iran war levels. The dollar, serving more as a barometer of risk aversion than a genuine safe haven, is declining.
Rising oil prices have had the dual effect of constraining consumer demand while significantly improving the U.S. external balance. Petroleum product exports accelerated to 12.7 million barrels per day last week, as the closure of the Strait of Hormuz diverted tankers to American shores. Meanwhile, household real income has been eroded by higher energy prices. The deterioration in confidence surveys has been dramatic, with the University of Michigan index plunging. Discretionary consumption has been declining since Q4, compounded by real estate transactions hitting historic lows. Developer confidence has tumbled, with the NAHB survey falling to 34 in April. In China, growth reached 5% year-on-year in Q1. However, retail sales continue their deceleration, while private sector productive investment is improving somewhat. Real estate investment plummeted another 11% annually. Chinese growth is now driven solely by exports. In the eurozone, inflation has been rounded up to 2.6% following multiple revisions in France, Italy, and Spain. The underlying inflation remains stable at 2.3%. The price action in financial assets is clearly consistent with crisis resolution. News flow is being interpreted asymmetrically to the upside. Implied volatility is retreating below 20% on equity derivatives, while stock indices are hitting fresh records in Japan and the United States. Technology is driving indices higher, and U.S. bank earnings have come in significantly better than expected. Their disclosure of private credit market exposures—exceeding $100 billion in total—has not troubled market participants.
In bond markets, the Bund has fallen back below the 3% threshold, while the T-note is also easing (down 9 basis points on the week to 4.23%) in response to crude's slide, which accelerated following news of the Strait of Hormuz reopening. The oil price decline is reducing the ECB rate trajectory anticipated by financial markets. Gilts remain the most sentiment market given the Bank of England's precarious position regarding inflation risks. In credit markets, auction demand remains robust and spreads are tightening. Euro investment-grade is trading at 67 basis points over swaps—2 basis points tighter than when the war began. High yield still has some catching up to do. Spread compression could complete the risk asset rally.
Axel Botte
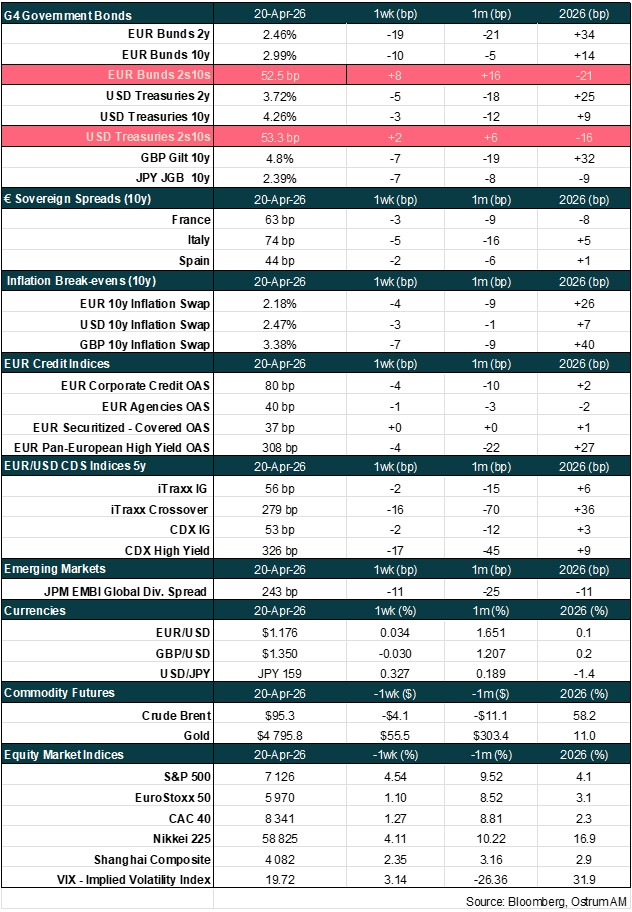
Main market indicators