Read our market review and find out all about our theme of the week in MyStratWeekly and its podcast with our experts Axel Botte, Aline Goupil-Raguénès and Zouhoure Bousbih.
Summary
Listen to podcast (in French only)
(Listen to) Axel Botte’s podcast:
- Review of the week – AI triggers a market sell-off, the Fed and ECB hold steady, US growth reaches 3.4%.
- Theme – The bond-equity correlation puzzle – Evidence from the Euro Area.
Podcast slides (in French only)
Download the Podcast slides (in French only)Topic of the week: The bond-equity correlation puzzle – Evidence from the Euro Area
- Equity-bond correlation is essential to asset allocation decisions. The correlation between bond and equity returns oscillates between positive and negative regimes. The link between equities and bonds is driven by whether inflation or growth concerns dominate markets, not a structural constant.
- Looking at evidence from the euro area, negative correlation dominated 2002-2021 during the sovereign debt crisis as Bunds served as safe havens while peripheral spreads widened.
- Positive correlation since 2022: the inflation shock drove correlation to high levels by 2024, before it moderated to less extreme levels by mid-2026 as ECB pivoted but the correlation regime remains positive.
- Inflation is the key driver of the swings in bond-equity correlation: when core CPI exceeds ~2%, expect positive correlation and reduced bond diversification; when anchored below 2%, negative correlation prevails.
- Portfolio implications — current positive regime means traditional 60/40 portfolios face higher volatility than 2000-2021, though performance over 36-month windows remains broadly similar across regimes.
The Bond-Equity Correlation Puzzle, Evidence from the euro area
The correlation between equities and bonds is essential to asset allocation. There are prolonged periods of positive or negative correlation, which determine diversification benefits. Positive correlation has been more frequent over the long run but since the beginning of the euro area, negative correlation has prevailed until the inflation outburst in 2022. We shed some light of the drivers of correlation in this short piece.
Bond-Stock Correlation: A Regime Analysis (Euro Area 1999–2026)
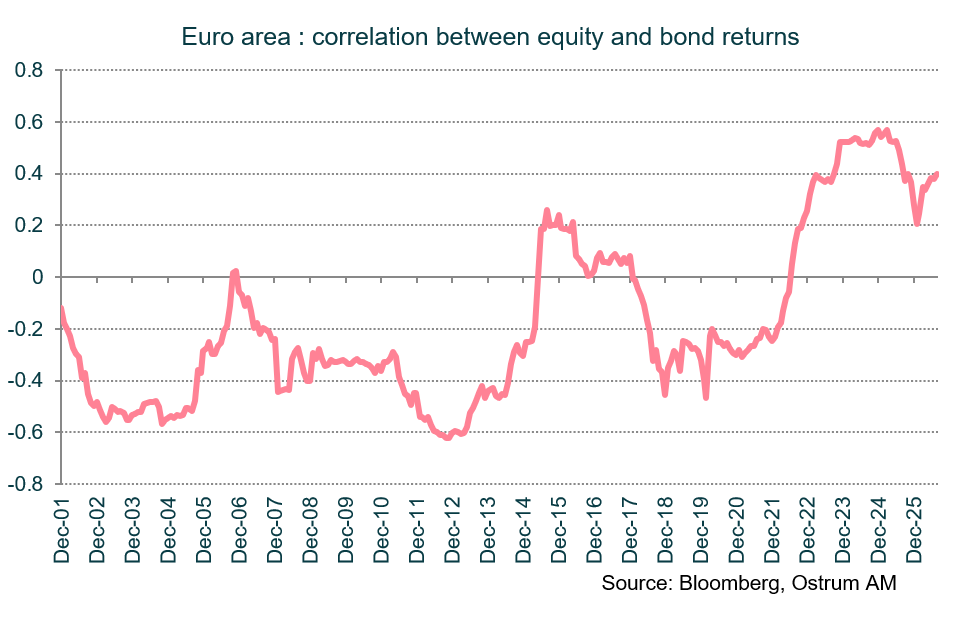
The chart below shows the 36-month rolling correlation between equity returns (Euro Stoxx 50, excluding dividends) and bond returns (approximated by changes in the 10Y Bund yield). The single most important insight is that this correlation is not a structural constant — it oscillates between positive and negative regimes driven by the dominant macro force of the day (inflation, growth) and the level of stress in financial markets.
Bond-equity correlation varies sharply over time
When inflation is the primary risk, bonds and stocks move in tandem (positive correlation). When growth/recession risk dominates and inflation is anchored, bonds serve as a safe haven and the correlation turns negative. Geopolitical shocks matter insofar as they shift which of these two forces is dominant.
The Euro Area (EA), which began in 1999 with the launch of the single currency, has had a short but eventful history. Both worldwide and regional developments have caused sharp swings in correlation.
- Negative from the Start (2002–2007) — Dot-Com Bust & Iraq War
Bonds cushion portfolios in equity drawdowns
The first measurable 36-month window (from 2002) already shows a negative correlation of –0.18 to –0.49, reflecting the dot-com bust and the ECB's accommodative response. The Iraq War (2003) deepened the flight-to-quality dynamic. Bund yields fell as the ECB cut rates while the Euro Stoxx 50 declined sharply from its 2000 peak of ~5,250 to a trough near 2,037 in March 2003. By 2003–05, the correlation reached –0.51 to –0.57. The pre-GFC recovery (2006–07) briefly lifted correlation toward zero as synchronized global growth reduced the safe-haven premium in Bunds.
- GFC and Sovereign Debt Crisis (2008–2013) — Deepest Negative
Correlation is deeply negative in financial crises
The GFC (2008–09) pushed correlation back to –0.41 as Bunds rallied on flight-to-safety. The sovereign debt crisis (2010–12) then drove the most extreme negative readings in the sample: –0.62. This was a uniquely European dynamic: peripheral spreads blew out (Italian, Spanish, Greek yields surged) while German Bund yields fell to record lows as investors fled to the EA's only true safe haven. The expectations of a breakup of the European Monetary Union and currency redenomination risk only pushed Bund yields down further. Euro Stoxx 50 fell from ~3,000 to below 2,100 in 2012 while Bund yields compressed toward 1.2%. Draghi's "whatever it takes" speech (July 2012) and the OMT announcement stabilized peripheral markets but kept Bund yields anchored low, sustaining negative correlation through 2014.
- ECB QE and Reflation (2015–2017) — Brief Positive Interlude
Reflation via QE benefits bonds and equities
The ECB's launch of its Asset Purchase Programme (March 2015) created an unusual dynamic: QE simultaneously suppressed Bund yields (bond-positive) and lifted equities (risk-on). As the reflation trade took hold in 2016–17, correlation briefly turned positive (+0.19 to +0.24) — the only sustained positive episode in the EA before the 2022 inflation shock. This mirrors the US "Great Moderation" dynamic where synchronized growth drove both assets in the same direction.
- Trade Wars, COVID & Return to Negative (2018–2021)
US-China trade tensions (2018–19) and COVID (2020) pushed correlation back negative (–0.25 to –0.46). The ECB's pandemic emergency purchase programme (PEPP) reinforced the safe-haven status of Bunds, and with inflation well below target, the negative correlation regime reasserted itself.
- Inflation Shock and Positive Regime (2022–2026)
The correlation turned strongly positive — reaching +0.57 by late 2024 — as the ECB hiked rates by 450 bps in 2022–23 to combat inflation that peaked above 10% in the euro area. Both Bunds and Euro Stoxx 50 sold off simultaneously in 2022. The 2026 Middle East conflict, which drove energy prices sharply higher and boosted near-term inflation expectations, has sustained the positive correlation regime.
By mid-2026, the EA correlation has moderated to +0.33–0.39 as disinflation has progressed and the ECB has pivoted toward cuts, though the regime remains positive — consistent with CPI still above target and geopolitical risk premia elevated in energy markets.
Key Takeaways for Portfolio Construction
- The negative correlation of 2000–2021 mired by several crises may be rather the exception than the norm. Using US data, most research papers find that the prior 40 years (1960–2000) were predominantly positive-correlation regimes.
- Inflation is the master switch. When core CPI is above ~2% and rising, expect positive correlation and reduced diversification benefit from bonds. When inflation is anchored below 2%, negative correlation and strong bond hedging properties tend to prevail.
- Geopolitical shocks matter through their inflation channel. Oil-supply shocks push correlation positive; geopolitical shocks that are growth-deflationary (GFC) push it negative.
- The EA sovereign crisis created a uniquely European amplifier (2010–2013), driving correlation to its most negative readings (–0.62) as Bunds became the region's only safe haven while peripheral spreads blew out.
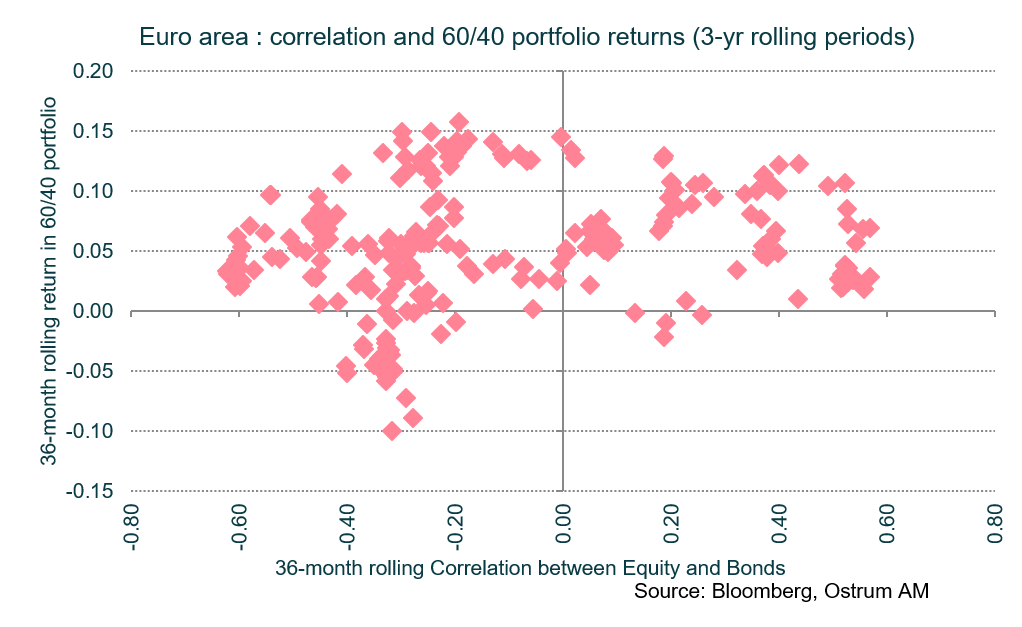
- The current positive-correlation regime implies that traditional 60/40 portfolios face higher volatility than in the 2000–2021 period. That said, the performance of the 60/40 portfolio appears unaffected by changes in the bond-equity correlation, although higher correlation implies a deterioration in the risk-return trade-off. Performances measured over 36-month rolling windows have indeed been broadly similar in both negative and positive correlation environments. However, sharply negative returns (up to -10% per annum over 3 years) have only occurred under negative correlation regimes, most notably during the great financial crisis.
Conclusion
The euro area bond-stock correlation has oscillated dramatically between negative and positive regimes since 1999, driven primarily by whether inflation or growth dominates market concerns. During periods of low, anchored inflation (2002-2021), bonds served as effective portfolio hedges, while the current inflation-driven regime (2022-2026) has sustained positive correlation. Geopolitical shocks matter mainly through their impact on inflation expectations whereas deflationary events maintain negative correlation. The shift toward positive correlation since 2022 implies that traditional 60/40 portfolios face higher volatility and reduced diversification benefits. Portfolio performance over rolling 36-month periods has remained broadly similar across both regimes.
Axel Botte
Chart of the week
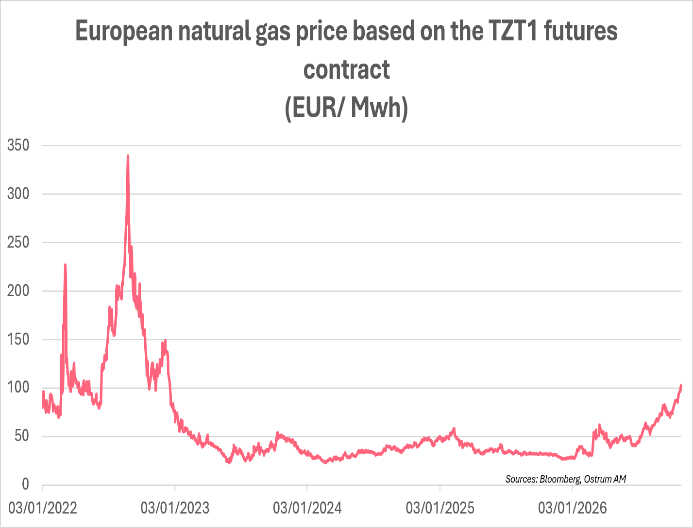
A sense of déjà vu... European gas prices are climbing again, rising above €105/MWh, up 42% over the month and more than 266% since the start of the year.
The surge in gas prices reflects a supply shock in the Middle East, compounded by unusually low European inventories, disruptions to gas supplies from Norway and, finally, intensifying competition with Asia for LNG, just months before Russian supplies are phased out.
Higher gas prices are also encouraging greater use of coal for power generation, pushing European carbon allowance prices above €90 per tonne, their highest level since mid-March.
Figure of the week
43
The BoJ announced that it will triple the pace of its ETF sales to $5.5bn. At this rate, it would take 43 years to fully unwind its holdings, compared with 100 years under the previous plan.
Market review: Beyond Rates, Freedom: Farewell, Christine Lagarde!
- Fed: Patience, but no let-up in the fight against inflation.
- ECB: On hold, but the door remains wide open to a rate hike in December.
- France: The OAT spread jumps to 166 bps amid a deteriorating growth outlook.
- Equities: The rotation away from AI is benefiting European stocks.
Beyond Rates, Freedom: Farewell, Christine Lagarde!
The Fed and the ECB are taking a breather as inflationary pressures persist. Tech stocks are once again under pressure. European gas prices have reached €105/MWh, bringing back a distinct sense of déjà vu...
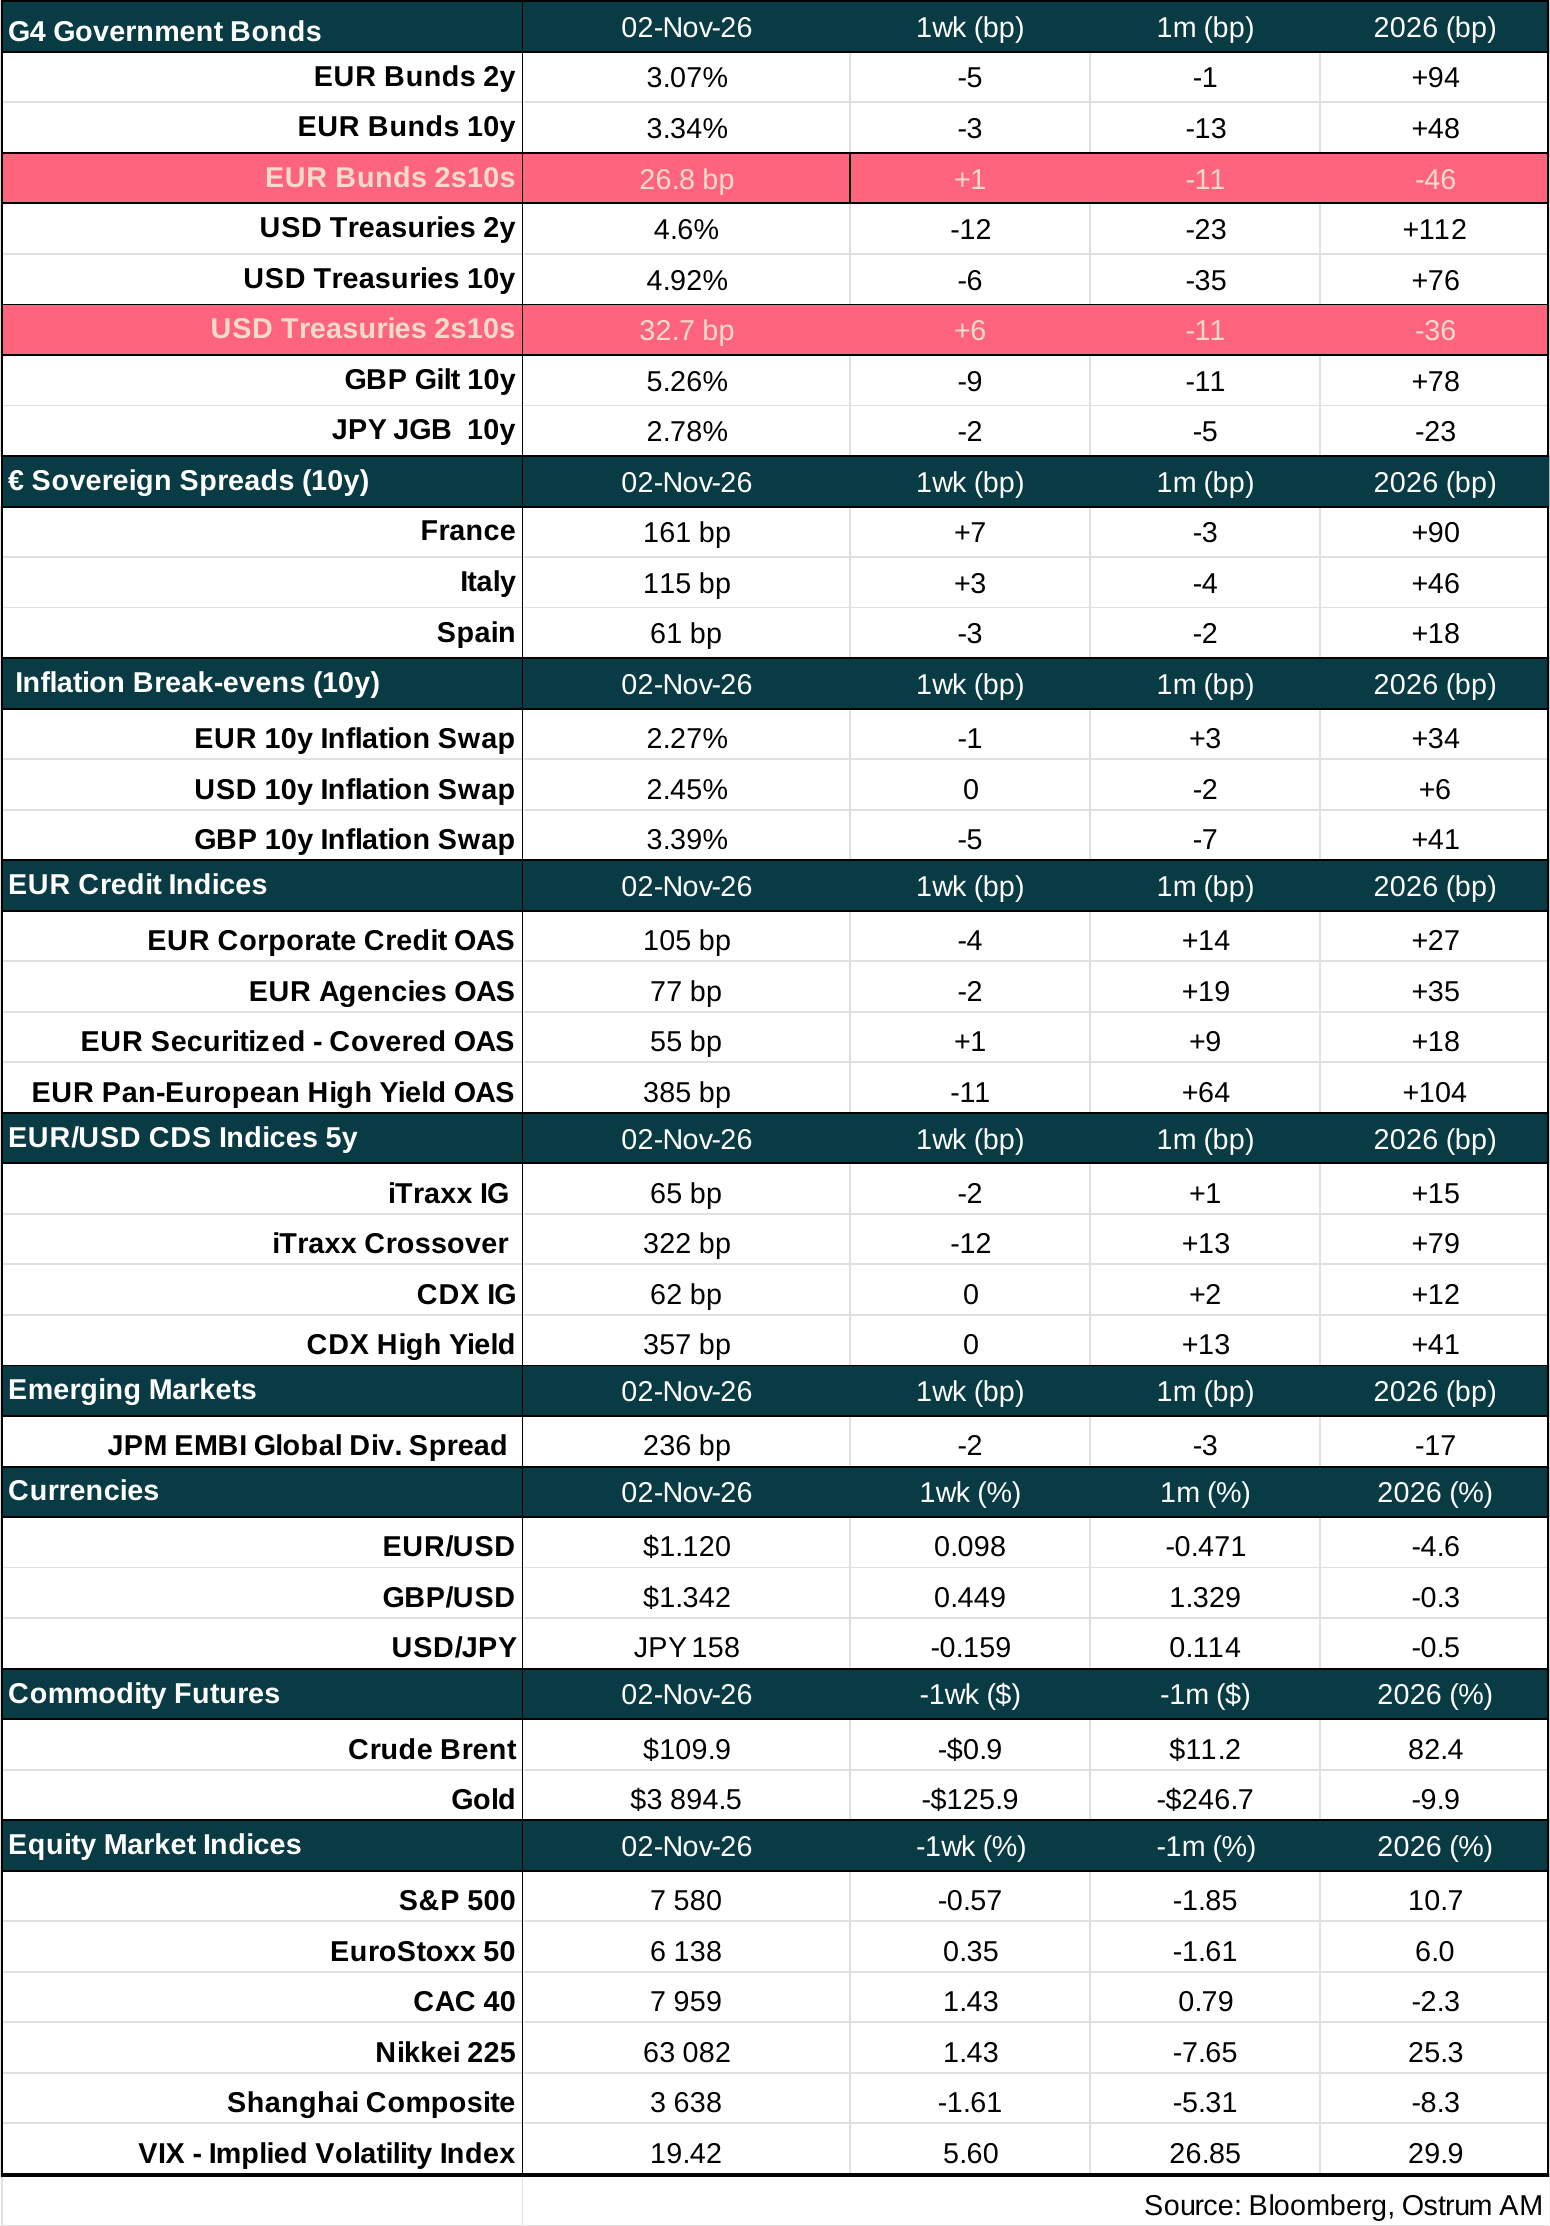
The earnings season set the pace for US equity markets. After attempting to rebound at the start of the week, the Nasdaq fell 1.5%, while the S&P 500 gained 1.3% and the Russell rose 3%, reflecting a rotation away from AI. The Fed opted for patience despite inflation remaining elevated, with PCE inflation at 3.6% YoY, and US growth now described as “strong”. Tighter financial conditions have given the Fed room to pause, although K. Warsh is keeping the option of another Fed funds rate hike in December on the table. US Treasury yields declined across the curve, with the 10-year yield ending the week below 5% for the first time since mid-September, despite highly volatile oil prices, with Brent trading at $117 per barrel, and solid economic data. Third-quarter GDP growth accelerated to an annualised quarterly rate of 3.4%, from 2.2% in Q2, as a strong contribution from domestic demand offset the negative contribution from net trade. K. Warsh also announced changes to the FOMC meeting schedule. From next year, one FOMC meeting will be held without a vote on the Fed funds rate path, rising to two meetings in 2028.
In the euro area, sovereign bond markets remained subdued ahead of the ECB meeting. C. Lagarde confirmed that she will step down early, on 7 February 2027. The ECB kept its three key policy rates unchanged despite accelerating inflation fuelled by higher energy prices, while leaving the door open to another rate hike in December. The ECB justified its decision by the absence of second-round effects, a factor that should be reflected in its updated December projections. Euro-area growth surprised to the upside in Q3, at 0.4% QoQ and 1.3% YoY, once again driven by Ireland, where GDP expanded by 5.5% QoQ. Excluding Ireland, euro-area growth stood at 0.2% QoQ.
France is diverging worryingly from the rest of the region. GDP contracted by 0.1% QoQ in Q3, following zero growth in Q2 and a 0.2% contraction in Q1. Meeting the government’s 0.5% growth target would require GDP growth of 0.9% in Q4, which looks challenging. The 10-year OAT-Bund spread widened by more than 10 bps over the week to 165 bps. C. Lagarde played down the prospect of imminent intervention in the OAT market. In contrast with their US counterparts, European equity indices posted strong performances this week, with the EuroStoxx up 1.7%, the DAX 2.8% and the CAC 40 2.48%, supported by a solid earnings season.
In emerging markets, the Brazilian real was the worst-performing currency following Lula’s victory, falling 8% against the US dollar amid the unwinding of yen-funded carry trades. Attention is now shifting to the fiscal outlook. The appointment of the next Finance Minister will be key for Brazilian assets.
Zouhoure Bousbih
Main market indicators
-

Axel Botte Head of markets strategy