

Read our market review and find out all about our theme of the week in MyStratWeekly and its podcast with our experts Axel Botte, Aline Goupil-Raguénès and Zouhoure Bousbih.
Summary
Listen to podcast (in French only)
(Listen to) Axel Botte’s podcast:
- Review of the week – Markets take stock amid rate pressures;
- Theme – An estimate of asset sensitivity to real rates.
Podcast slides (in French only)
Download the Podcast slides (in French only)Topic of the week: A rough calibration of the market impact of higher U.S. real yields
- The study models a "beta surface" crossing 5 levels of real yields (10Y TIPS) and 5 weekly change magnitudes, delivering a non-linear and conditional asset sensitivity analysis;
- The negative sensitivity of equities (S&P 500 and Nasdaq) to rising real yields is most pronounced above the critical 2% threshold, where a weekly rise of +10 basis points triggers a 3% to 5% decline in indices; similarly, High Yield spreads widen significantly when real yields rise from already-elevated levels;
- Gold proves highly sensitive to the direction of real yields, with rapid yield increases in high real rate environments acting as a drag, whereas any stabilization in yields—even at elevated levels—proves highly beneficial;
- The US dollar exhibits a systematic positive correlation with rising real yields, driven by carry and positioning dynamics that strengthen as the general level of interest rates increases.
A rough calibration of the market impact of higher U.S. real yields
One of the most striking developments in financial markets this year has been the sustained uptrend in real yields globally. Higher long-term real interest rates may signal stronger growth ahead or raise discount factors and thus weigh on asset prices. In this note, we estimate the impact of higher real yields on U.S. financial markets looking at sensitivities of a range of assets to both level and changes in inflation-adjusted long-term yields.
Exploring the market impact of higher real yields
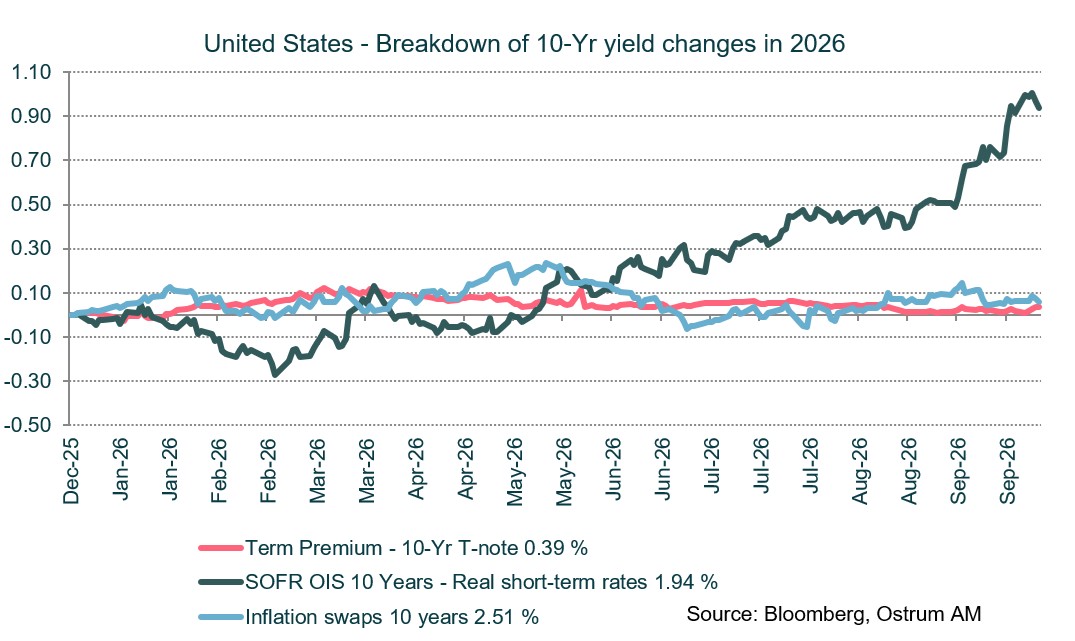
Higher real yields stem from expectations of high real rates.
This year’s uptrend in real yields is global in scope and came as a surprise to most market participants. There are a range of factors behind the steep increase in inflation-adjusted bond yields. First and foremost, the energy price shock following the Iran war reshaped the inflation outlook. Whilst money markets expected rate cuts early on this year, the Fed and other central banks raised interest rates instead in a bid to curb demand and price pressures. All else equal, central banks may have to maintain real rates higher for longer given the balance of risks to inflation. Thus, expected short-term real interest rates, as reflected in the overnight index swap (OIS) curve, have increased. Furthermore, the current AI investment boom has the potential to raise productivity growth for years to come. Higher potential output should raise real interest rates. In addition, the U.S. federal deficit has increased due to tariff paybacks, increasing debt interest charges and Medicare and social security outlays. Though the term premium measured by the T-note spread over OIS was relatively stable, fiscal imbalances should be conducive to real interest rates.
The approach: building a beta surface
We want to estimate the betas of a range of asset prices to the level and changes in real bond yields. In this note, we use weekly data from January 2003 to September 2026, a set of 1 240 observations. Our real yield measure is the real yield on 10-Yr U.S. Treasuring Inflation Protection Securities. The risky assets are the S&P 500 price index (SPX), the Nasdaq composite index (NDX), the price of gold, and spreads on U.S. investment grade (IG OAS) and high yield corporate bonds (HY OAS).
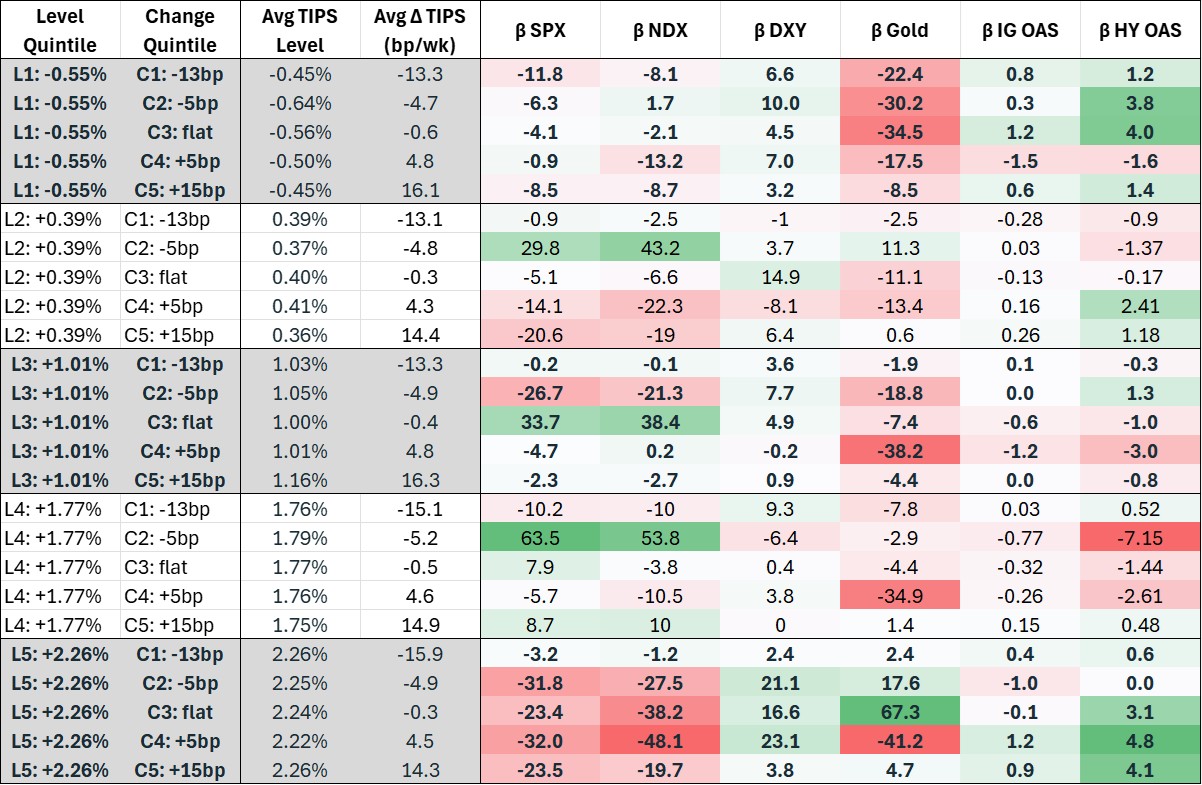
The objective is to build a beta surface. Each weekly return observation is assigned to one of five real yield level quintiles (based on the TIPS yield at the start of the week) and one of five yield change quintiles (based on the contemporaneous weekly TIPS yield change). Within each of the 25 level/change combinations, beta is simply estimated as ordinary least squares. This is equivalent to running a local linear regression — a non-parametric conditional beta surface.
The mid-points of the five real yield level quintiles are L1 ≈ −0.55% (low yields), L2 ≈ +0.39%, L3 ≈ +1.01%, L4 ≈ +1.77%, L5 ≈ +2.26% (high yields). The mid-points for the weekly changes in real yields are C1 ≈ −13bp/wk (large falls), C2 ≈ −5bp, C3 ≈ flat, C4 ≈ +5bp, C5 ≈ +15bp/wk (large rises).
The beta surface
The beta surface shows local asset betas to both levels and changes in real yields.
Caveats
Cell-level OLS betas are estimated on ~40–65 observations per cell. Noise is non-trivial, particularly in the extreme change quintiles (C1, C5).
The TIPS market was less liquid pre-2004; early observations carry more measurement noise in the real yield series.
Betas are unconditional within each cell (no controls for growth, inflation, or risk-off shocks), so causality cannot be inferred — the surface captures co-movement, not structural relationships.
Takeaways from the calibration
Equities — SPX and Nasdaq
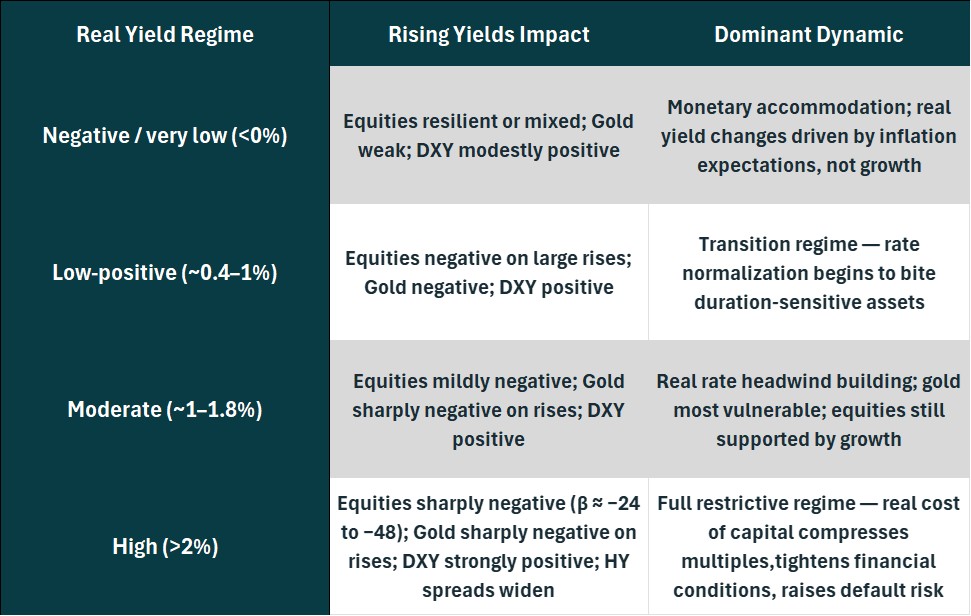
The equity beta to real yield changes is strongly non-linear and regime-dependent. The critical finding is that the negative beta to rising yields is almost entirely concentrated in the high real yield regime (L5: ~+2.26%). At L5 with rising yields (C4/C5): SPX and Nasdaq betas are quite negative. A +10bp weekly TIPS move at high real yield levels is associated with roughly −3% to −5% equity underperformance. At L5 with small yield falls (C2), equities also struggle when yields are high even on modest relief rallies, suggesting the level itself is the dominant headwind.
At low/negative real yields (L1–L2), equity betas to yield changes are mixed and often near zero or positive. This may be a sign of a “favorable disinflation" regime where falling real yields and rising equities co-exist like the post-Covid period. The L3/C3 cell (real yields ~+1%, flat week) shows anomalously high positive betas (+34 SPX, +38 NDX), likely capturing the 2004–2006 and 2017–2018 "Goldilocks" periods where moderate real yields were consistent with strong growth.
DXY
The USD exhibits a consistently positive beta to rising real yields, which strengthens at higher yield levels as during the 2022–2023 tightening episode. Even when yields fall modestly from high levels, the USD remains bid, suggesting carry and positioning effects dominate. At low real yields (L1–L2), DXY betas are positive but smaller, consistent with a weaker real rate transmission to FX.
Gold
Gold's beta surface is the most asymmetric and regime-sensitive of all assets: high and rising real yields are deeply hostile to gold with the most negative cell in the entire surface. A striking positive reading is observed with high and steady yields. This captures relief rallies as yield stabilizes. At negative real yields (L1), gold beta is consistently negative across all change quintiles, which is counterintuitive but reflects the 2020–2022 period where gold peaked and then sold off even as real yields remained deeply negative — driven by positioning unwinds and crypto competition. Moderate real yields rising sharply are also damaging for gold. The direction of real yields appears to matter more for gold than their level.
IG and HY Credit Spreads
Credit spread betas to real yield changes are small in absolute terms across most of the surface, reflecting that OAS is driven more by credit risk premia than by real rate moves in isolation. IG OAS betas range from −1.5 to +1.2 bps per 1% TIPS move. The largest widening signal is at L1/C4 (−1.5 bps, i.e., IG tightens when yields rise from negative levels — consistent with "growth is back" dynamics).
HY OAS shows more sensitivity at high real yield levels: at L5/C4, beta is +4.8 bps and at L5/C5, beta is +4.1 bps. High yield spreads widen when real yields rise from already-high levels, consistent with recession risk pricing. The L4/C2 cell shows beta = −7.1 bps (HY tightens sharply on modest yield relief at elevated levels), capturing the 2023 soft-landing rally.
Higher real yields inflict a degree of restrictiveness on asset prices.
Another caveat: focus on the post-2003 period
The post-2003 sample offers a cleaner, more homogenous period.
Restricting to post-2003 data produces a cleaner, more internally consistent beta surface with three key improvements over the full-sample estimates:
Equity betas are unambiguously negative at high real yield levels — the paradox of positive equity sensitivity at very high real yields disappears. The post-2003 surface shows a monotonic relationship: the higher the real yield level and the larger the yield rise, the more negative the equity beta.
Gold's negative sensitivity to real yield rises is stronger and more consistent — the pre-2003 secular gold bear market was contaminating the full-sample estimates with spurious positive betas at high yield levels.
HY credit betas are materially more negative at high real yield levels — the post-2003 sample captures the 2007–2009, 2015–2016, and 2022–2023 episodes where HY spreads widened sharply alongside real yield spikes, a dynamic absent in the pre-2003 HY market.
Note: The post-2003 quintile level boundaries are lower than the full-sample boundaries (L5 avg = 2.24% vs 3.35–3.74%). Direct cell-for-cell comparison should account for this shift — the post-2003 L5 corresponds approximately to the full-sample L4 in terms of absolute real yield level.
Conclusion
The rise in real yields may have far-reaching consequences in both financial markets and the economy. We have built a beta surface to gauge the impact of changes in real yields at different yield levels on asset prices. The results suggest that the impact varies greatly across assets, but the mostly negative impact of higher real yields appears more homogenous and monotonic in the post-2003 period.
Axel Botte
Chart of the week
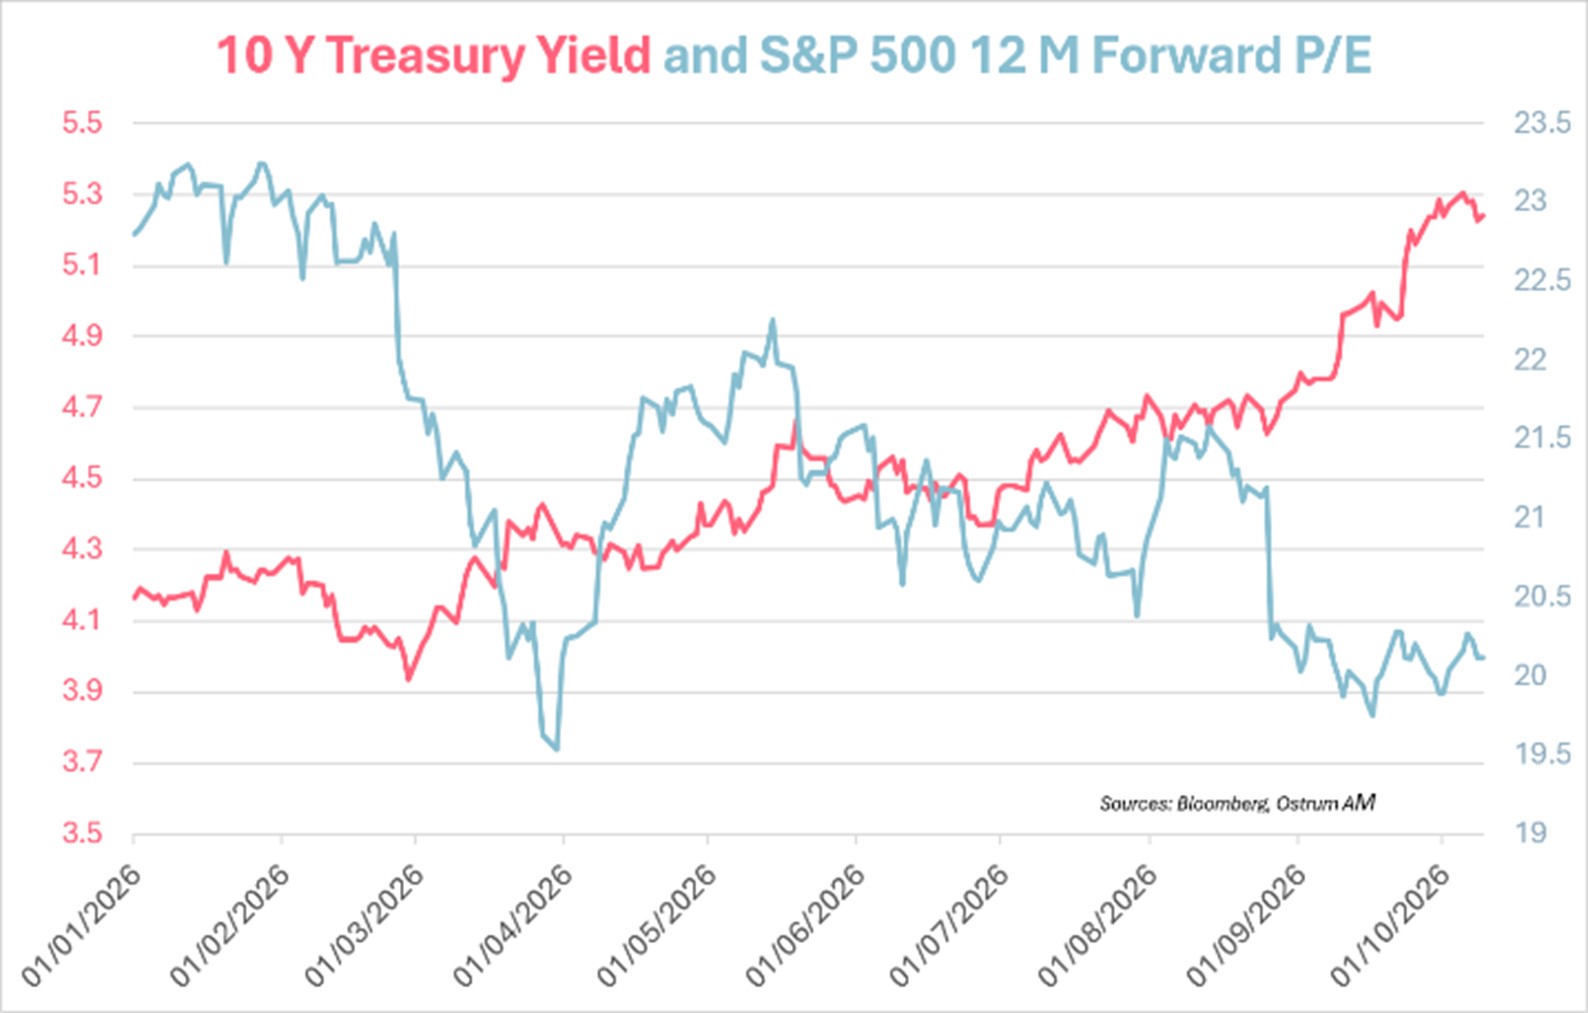
The apparent resilience of US equities to the sharp rise in long-term US Treasury yields is an illusion.
The S&P 500’s forward price-to-earnings ratio has fallen by nearly 20% from its recent peak amid the sell-off in Treasuries. Earnings growth has so far offset the sharp compression in valuation multiples.
However, we are likely approaching the limits of its ability to cushion the market.
Figure of the week
33
33% : the increase in sugar prices since the end of July.
Market review:
- U.S.: ISM services points to sustained growth;
- ECB: Lagarde reaffirms ability to use tools to stabilize markets;
- Bonds: Bunds near 3.50 % as OAT spreads hover about 140 bps;
- Equities: Earnings should underpin markets.
Markets Take Stock Amid Rate Pressures
Market participants are digesting the acceleration in yields and spread widening as the ECB signals its capacity to intervene.
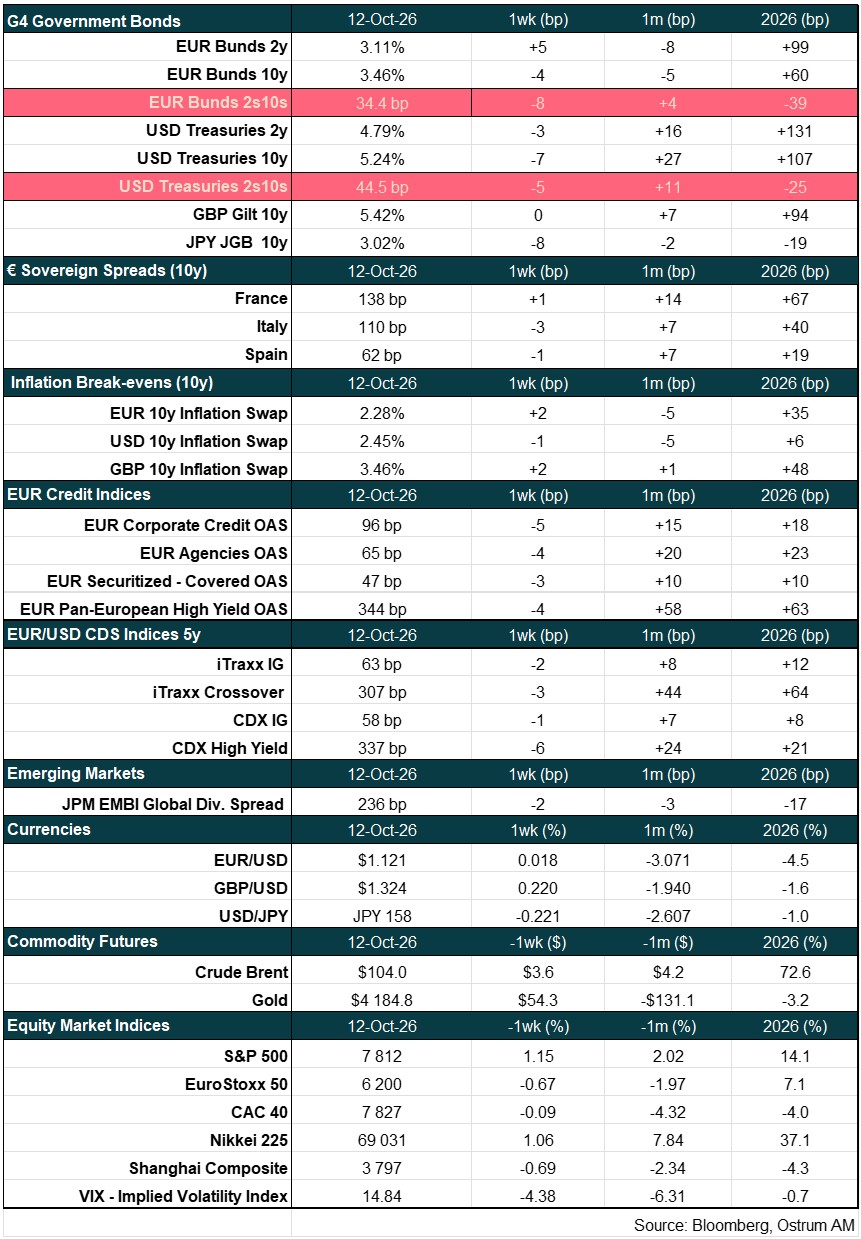
Financial markets experienced a week of consolidation. The rise in long-term yields is imposing a gradual reassessment of risk premia across interbank markets, credit, and equities. The earnings season will likely provide some support to equity markets, whilst bond markets remain subject to oil price fluctuations and fiscal concerns, notably in France.
On the economic front, US surveys paint a picture of solid growth momentum in the third quarter. The services ISM barely moderated to 54.9 in September, with employment improving to 50.1 and orders remaining robust at 59.8. By contrast, consumer confidence continues to deteriorate just weeks before the midterm elections, which are widely expected to produce a change in the political balance of power. The other major imbalance concerns the external deficit, which reached $105 billion in August. The renewed rise in mortgage rates (30-year at 7.49%) comes just as residential investment was showing tentative signs of stabilization. Against this backdrop, the September FOMC minutes confirmed the hawkish bias that had justified the 25 basis point rate hike. A further increase is penciled in for December, though this week's price data (CPI, PPI, import prices) could alter the timetable.
Asset valuations are adjusting to the higher rate environment. The Bund is oscillating around 3.50%. The brief respite in French spreads proved short-lived, with the 10-year risk premium climbing back towards 140 basis points. Bond markets are awaiting a hypothetical ECB intervention. Christine Lagarde confined herself to reminding markets that the ECB has tools available to stabilize conditions, though the activation criteria remain deliberately vague. Italian BTP spreads eased to 106 basis points. In the United States, the T-note stands at 5.22% at the week's close, while the 2-year holds below 4.80%. Inflation expectations have moved little despite oil price volatility linked to the risk of US strikes on Iran and the threat to oil production from a hurricane in the Gulf of Mexico. Credit markets are gradually absorbing the pressure from higher rates and widening euro swap spreads (29 basis points at the 2-year). European bank stocks are under pressure in both credit and equity markets. Repo markets are showing signs of reluctance towards short-dated French and Italian paper. Euro IG credit spreads stand at 74 basis points, with all segments widening — including covered bonds, now at 23 basis points. High yield (at 344 basis points over Bunds) is showing signs of stabilization after a 58 basis point widening move, with the iTraxx Crossover trading around 307 basis points.
The earnings season is expected to confirm the exceptional profit cycle in the United States, where earnings growth has more than compensated for the impact of higher long-term interest rates. In the eurozone, bank stocks have sold off sharply alongside telecoms and cyclicals over the past month or so. In currency markets, the dollar remains firm while the yuan continues its appreciating trend.
Axel Botte
Main market indicators
-

Axel Botte Head of markets strategy